Smart water solutions for a city

Having described the basic solution components that go into the making of Smart City Solutions (you may refer to the articles : What it takes to be a Smart City – Part 1, What it takes to be a Smart City – Part 2), let me get started with solutions around smart water for a city. And yes, I will be relating back to the solution blocks explained in the previous articles as I go through them.
The solutions around Smart Water would be around making better use of the existing water resources a city has at its disposal so that it can maximize its reach to the citizens of a city.
The first solution that I’m going to explain is around ‘visibility of water flow’ through the water pipeline network.
This solution would enable city operators to know the amount of water flowing through water pipelines in a city at a given point of time. This is achieved by fixing flow meters along the pipeline.
Flow meters are sensors that measure the flow of water in a pipeline. They transmit their readings to the central server through various communication modes, which could be any one or a combination of radio and wireless protocols.
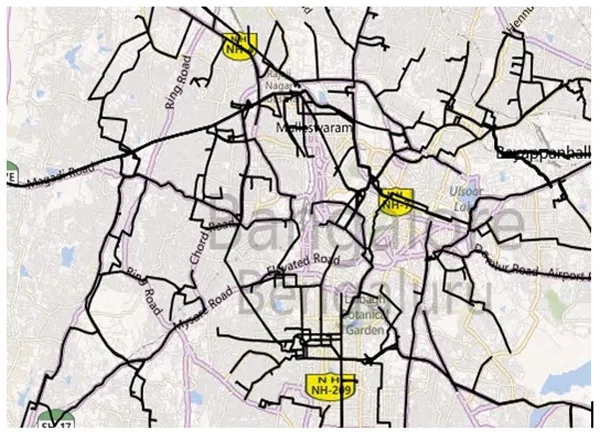
The diagram below shows a GIS map overlaid with a water pipe network. (This image is an illustrative example)
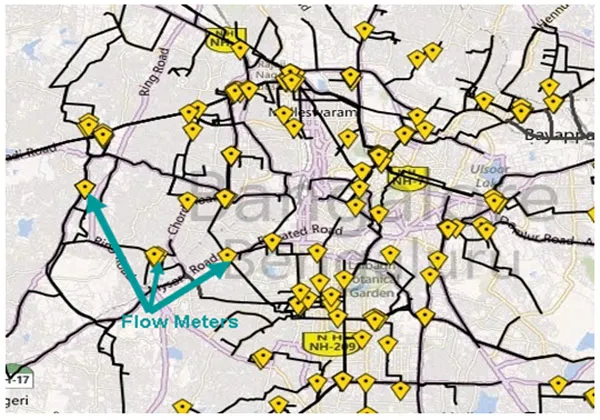
When flow meters are overlaid on them, the network would resemble the diagram below. The actual number of flow meters may vary as per the city requirements.
Flow meters on sending their data at regular intervals would allow city authorities to visualise water flowing through the city’s pipeline networks at any given point of time. The data coming from flow meters would be saved into a data repository. With that, it would even be possible for city authorities to gather the history of water flown across a single or a group of flow meters in a specific pipeline.
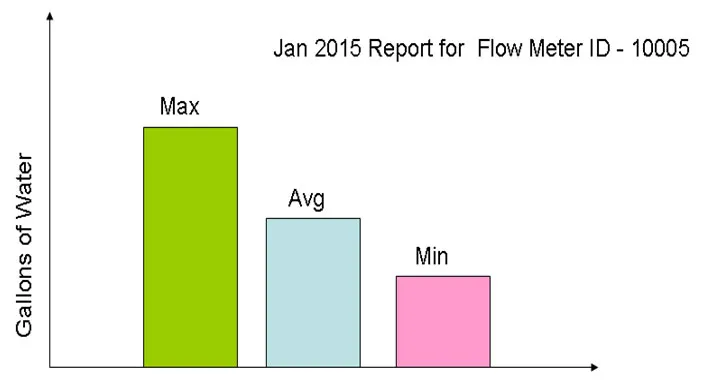
Below is an illustration of gallons of water that have flown through a single meter. It shows the maximum, average and minimum gallons passed through a specific flow meter with say ID 10005.
With historic data, it would be possible for the city to develop Key Performance Indicators (KPIs). This would allow the city operators to receive alerts whenever the amount of water flowing through a sensor is below or above a certain value in a dashboard. Once the city operators receive an alert, they would investigate the cause for KPI violation (whether it’s a faulty sensor or a water flow issue) . This process of identification of problems and mediation would be done in a predefined steps of a Standard Operating Procedure, in the event of KPI violations.
Relating back to the solution blocks of the smart city, the diagram below shows various aspects of the solution blocks in use (for the use-case above).
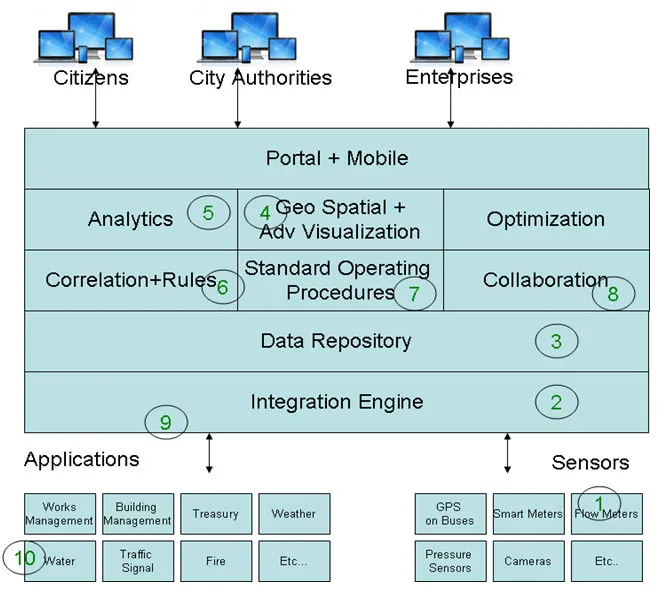
The process can be summarised as follows:
- Flow meters send data at regular intervals
- The data is captured by the ‘Integration Engine’
- The data is inserted into a ‘Data Repository’
- The visualisation of the flow meter readings is superimposed on the city’s GIS map as illustrated before.
- It would be possible to do Analytics on the readings; run a daily, weekly or a monthly report for an individual flow meter or a group of them. One can also perform a diagnostic analytics with the ‘Analytics Block.’
- It would be possible to set up rules for lower limit or upper limit of the KPIs in the ‘Correlation and Rules Engine.’
- Violation of the KPIs would kick off a ‘Standard Operation procedure.’
- The city authorities may want to do a web conferencing before arriving at the root cause of the issue in the “Collaboration Block.’
- The city authorities in case arrive at a conclusion that repair work needs to be done, they would raise a ticket or a ‘work order’ to be worked upon. Assuming that the application in which the ‘work order needs to be raised is already present as a part of the city’s application landscape the ‘Integration Engine’ is kicked off to pass the relevant details for the creation of a work order.
- A work order is created in the work order application for the water utility department. Besides work order, other data regarding the flow meter readings can be passed to the Applications in the water utility department.
Needless to say, the window to the Analytics, GIS, Collaboration, Standard operating procedures and Rules is through the ‘Portal+ Mobile’ solution block.
Extending the above use-case, let’s take a last case on solving ‘Non revenue water’ in a city.
The water that has been pumped into the Water Distribution network but not reached the customer is called ‘non-revenue water.’
Water authorities would typically divide their city`s geographical regions into ‘divisions.’ An example of this is provided in the illustration below, where a city section has been divided into different divisions.
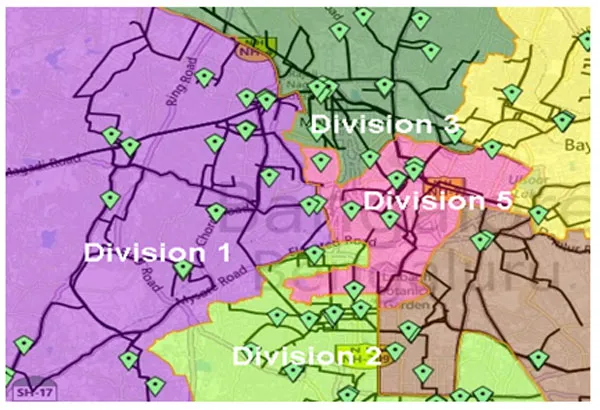
With the help of flow meters, cities can monitor the amount of water pumped into each division against amount of water used in the water pipeline network within each division.
To give a very simple example, say ‘Pipeline A’ supplies water to ‘Pipelines B’ and ‘C.’ Then,
Water flowing through A = Water Flowing through B + Water Flowing through C.
If the right side of the equation is less than the left side, it would mean there’s a leakage or pilferage of water between A to B or A to C (assuming no faulty reading of sensors). The solution would throw an alert, which, in turn, would kick off a standard operation procedure. This comparison is called “Balance of Water”. One can go for more accuracies if there are smart water meters installed at every customer.
We’ll conclude this section here. In the next article we’ll be discussing solutions around smart water systems. Make sure you don’t miss it!