YS Research: Making sense of Flipkart’s and Snapdeal’s valuations through their GMV

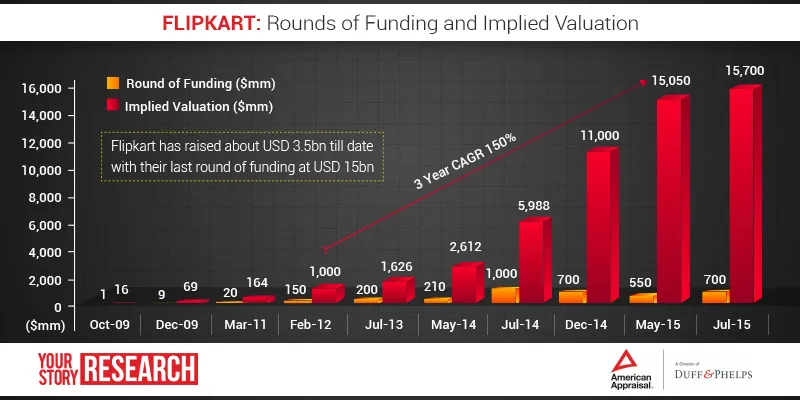
Bengaluru-based Flipkart has raised over $3.5 billion in 10 rounds of funding and is backed by investors like GIC, DST Global, Qatar Investment Authority, Tiger Global, Steadview Capital, ICONIQ Capital, and T. Rowe Price Associates. When it raised funding of $700 million in July 2015, its valuation stood at over $15 billion (see graphs for sourcing). Just as a comparison, Indian Oil Corporation’s market cap is a little under $15 billion.
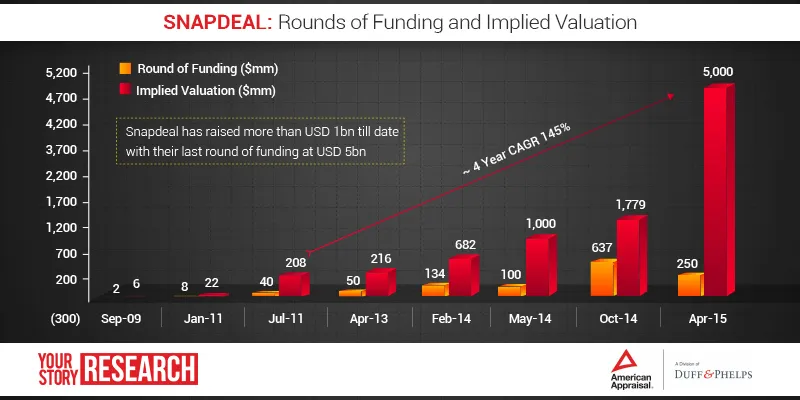
Gurgaon-based Snapdeal has raised almost half of what Flipkart has raised. The latest funding of $500 million, announced on Tuesday, brings Snapdeal’s total capital raised to $1.7 billion. Backed by investors like Alibaba, Foxconn, Softbank and Premji Invest, Snapdeal has crossed $5 billion in valuation (see graph for sourcing). This is comparable to Yes Bank’s market capitalisation.
While these companies are admired, questions have also been raised on the logic behind these stupendous valuation numbers, the likes of which have not been seen in the Indian startup world until now. Both are loss-making entities and while the two competitors have made noises of a public listing, neither seems close to actually going public.
However, the valuation numbers begin to make sense when correlated with their gross merchandise value (GMV), which is the total value of goods sold through the sites.
YS Research worked with American Appraisal, a division of Duff & Phelps, a provider of valuation and related advisory services, to understand this link between GMV and valuation. We have also compared the two top global e-commerce players Amazon and Alibaba to give greater context.
How are e-commerce companies valued
Aviral Jain, Director at American Appraisal, says companies are, typically, valued on the basis of income (discounted cash flows) and the market (trading or transaction multiples) approach.
E-commerce companies usually have a longer gestation period and this results in investors focusing more on the topline in the immediate term
says Aviral. However, this changes as the companies mature and growth stabilises. Profitability then becomes the critical metric to reach the valuation.
Why GMV?
The Indian e-commerce industry maybe young but is growing rapidly. At the start of the current decade online retail was a billion-dollar-industry. A Goldman Sachs report released this year pegs the industry size at $7 billion at present, with an expectation of reaching $220 billion in FY 2030.
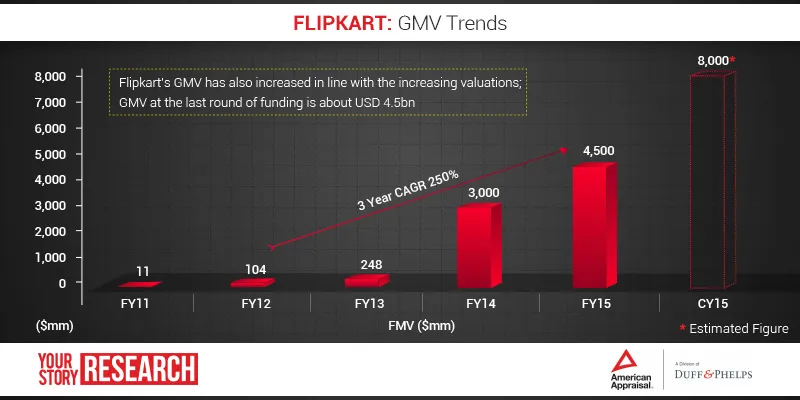
Companies are registering triple to four-digit growth in sales annually. “Flipkart’s GMV has increased about 50 times in the last three years. Hence, this becomes an important parameter in evaluating the company’s performance and the resulting next-round valuation,” says Aviral.
Flipkart’s valuation over the last three years has grown at a combined annual growth rate of 150%. In the same period, the eight-year-old company’s GMV has grown at 250%. Flipkart, according to reports, is targeting $8 billion in sales by end of 2015.
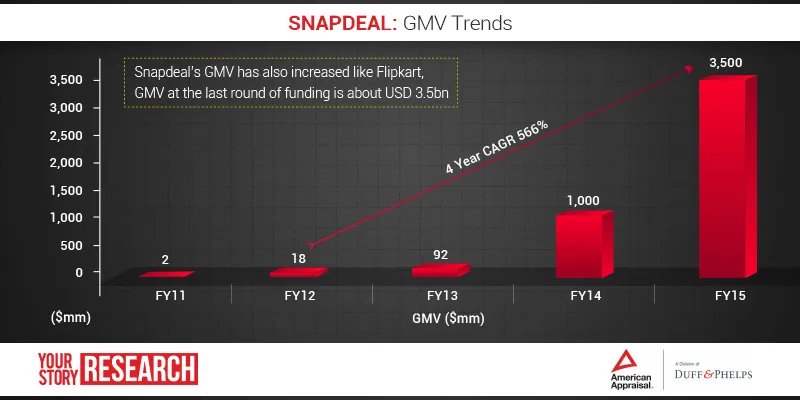
Snapdeal too has a similar trajectory in its valuation and GMV growth. Its valuation over the past four years has grown 145%, while GMV has grown 566%. The GMV growth of Snapdeal has been more dramatic, compared to its larger competitor, as it pivoted from a low-turnover group-buying model to the high sales e-commerce marketplace model in late-2011. At its current rate of sales, the company will reach $3.5 billion in GMV this fiscal. Since we do not have reliable information on the latest valuation of Snapdeal, we have not included the latest fund-raise details ($500 million raised in August) in the graphic below.
For online marketplaces, GMV is almost the only yardstick of performance right now, as these companies are not profitable. “Investors usually track the current level of Net GMV and the growth in Net GMVs to understand the sustainable commission income and the profit potential in future,” says Aviral. “This helps in determining an appropriate EV/GMV multiple...”
GMV Multiple
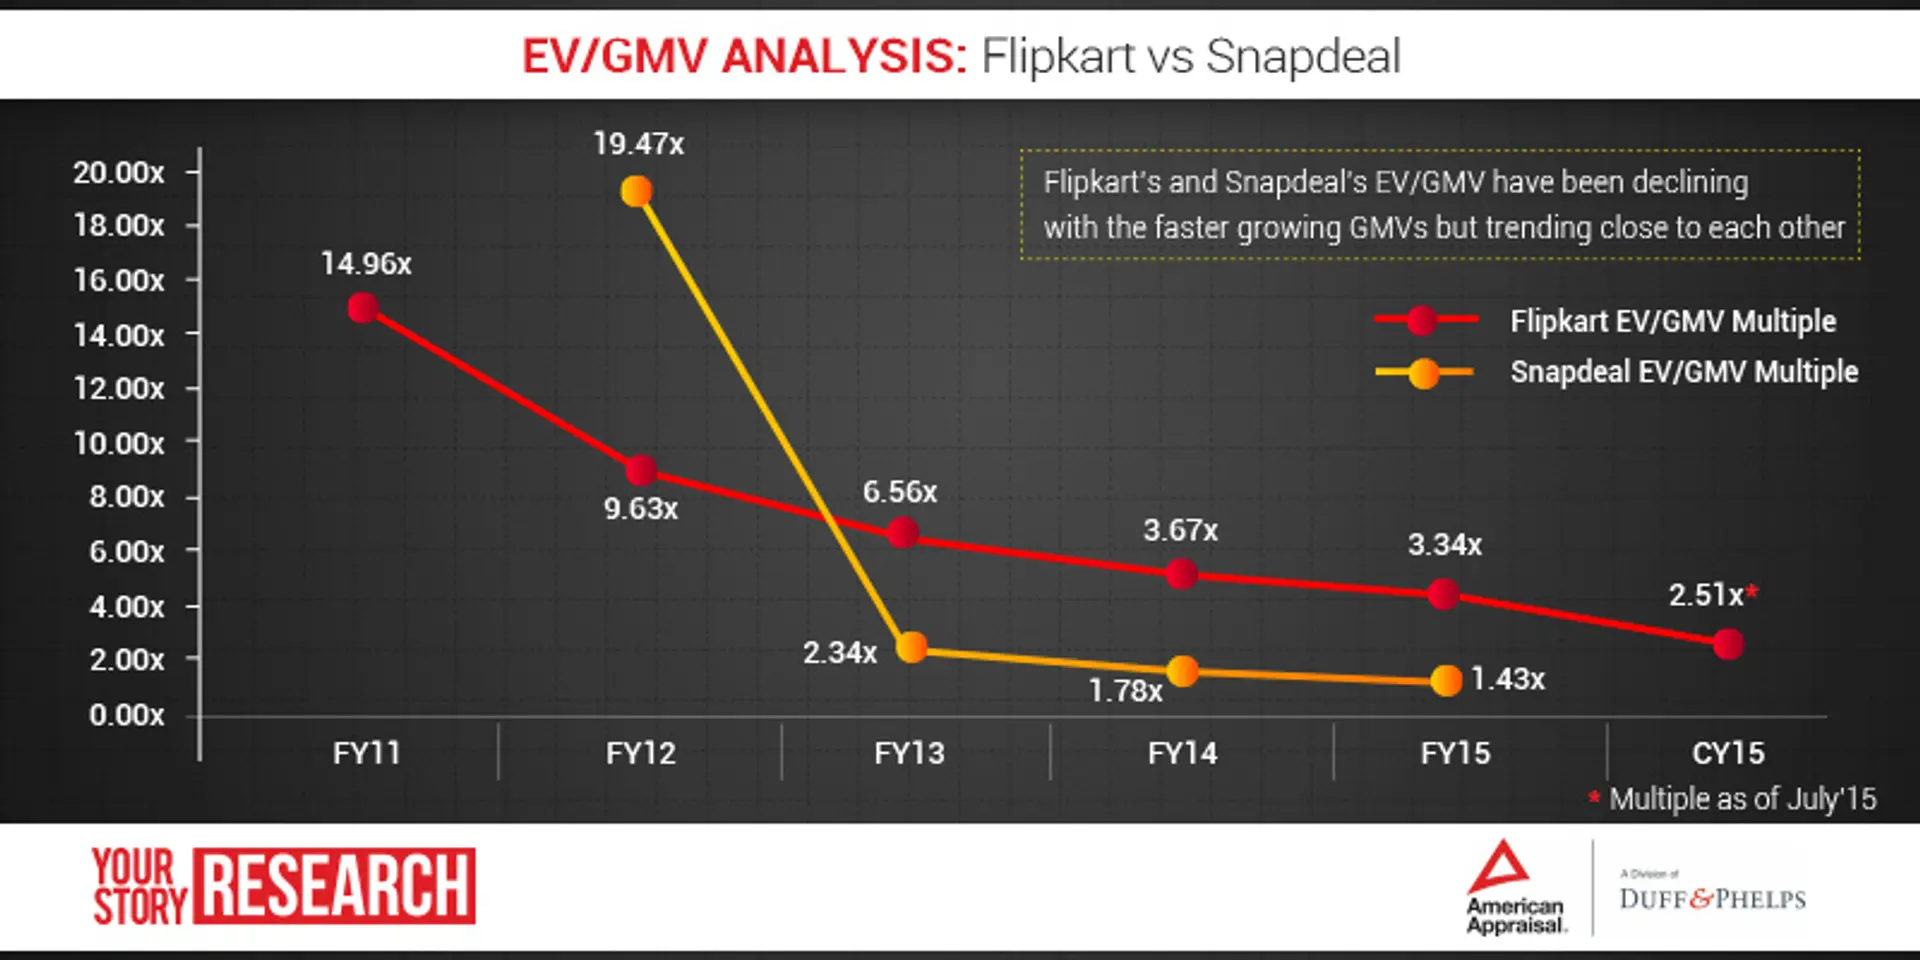
This is where the correlation between valuation and GMV becomes clear. When we look at the early years of fund raising, Flipkart’s and Snapdeal’s valuations might seem small. But when we compare their valuation with their GMV we see that it is now, at the higher absolute valuation, that the two numbers are trending close to each other. For instance, Flipkart’s implied valuation in 2011 was $164 million and GMV $11 million. So the valuation was almost 15 times GMV. Flipkart’s valuation in May was about $15 billion and GMV was $4.5 billion. That means the valuation is now only a little over three times the GMV. With GMV projected to grow to $8 billion this multiple is set to get lower.
Similarly, Snapdeal’s GMV multiple has come down from nearly 20 in 2012 to under two in FY2015.

In the early days, the expectation of growth was high, hence the higher GMV multiple. If we look at the GMV chart and look at the triple-digit-percentage growth the two registered, it is clear why investors feel the valuations were justified. As the two become mature companies and growth has begun to stabilise that multiple has come down.
Amazon vs Alibaba
At this point in our analysis it is fitting to look at the two international benchmarks when it comes to e-commerce—Amazon and Alibaba. The enterprise value-and-GMV multiple of these two giants have been trending in the 0.5x to 1x range since FY 2011, says Aviral of American Appraisal. This is the range that Flipkart’s and Snapdeal’s GMV multiple is trending towards.
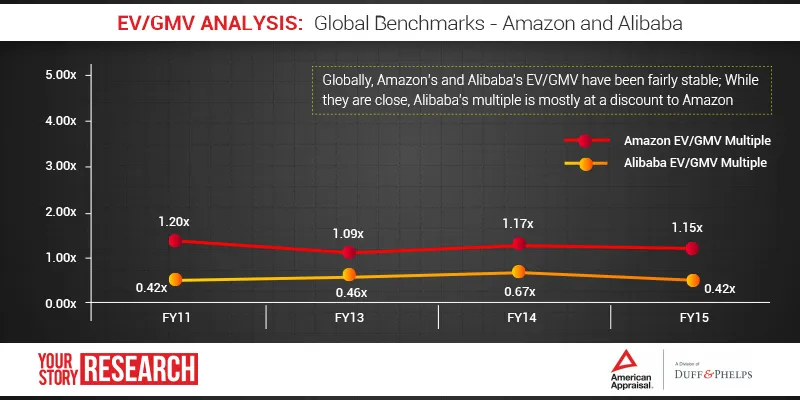
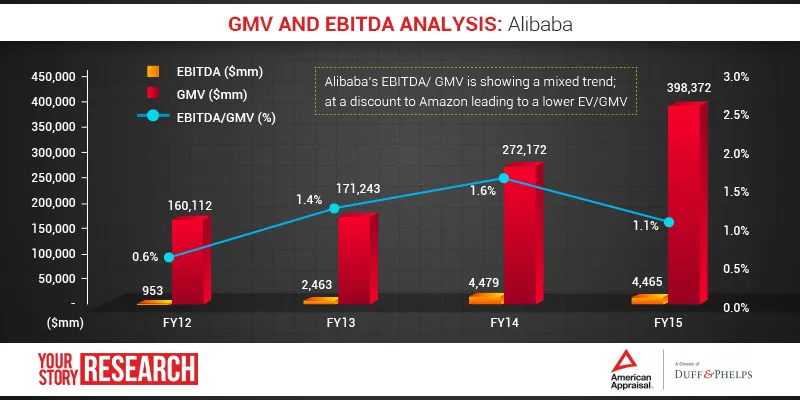
But why is Alibaba’s enterprise value-GMV multiple lower than that of Amazon, especially when Alibaba’s GMV is much higher than that of its American competitor? Alibaba’s GMV was almost $400 billion in FY 2015, as compared to Amazon’s GMV of $165 billion for calendar year 2014 (US companies follow calendar year and not financial year). Amazon’s GMV has been estimated by dividing fulfilment cost by the fulfilment cost as a percentage of estimated GMV. Aviral says:
Alibaba’s EV/GMV multiple (~0.5x) has been trading at a discount to Amazon’s multiple (~1x) due to lower profitability. Alibaba’s EBITDA margins (on GMV) is about 1.5% whereas Amazon’s margins are much higher at about 2.5%. This results in higher EV (enterprise value) for Amazon vis-à-vis Alibaba, resulting in higher EV/GMV multiple too.
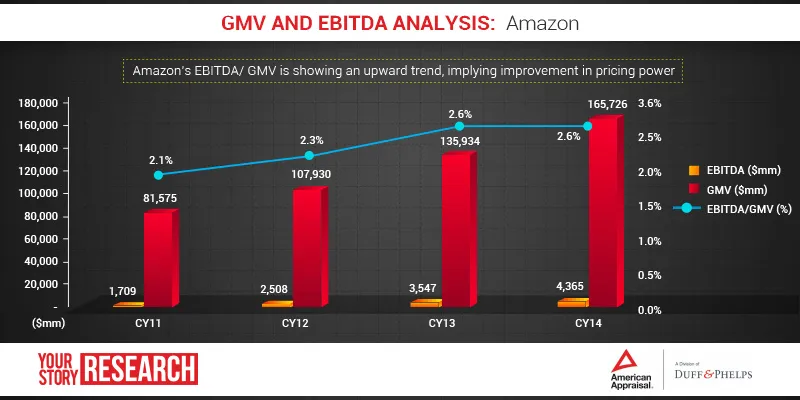
The upward trend in Amazon’s profitability is due to operating margins increasing from 3% in 2014 to about 5% in 2015. The North America region contributes more than 50% of its total global revenues. Another area where Amazon is seeing high growth and margin improvement is the Web services business. “Higher margins typically result in analysts pricing the stock at a premium sales multiple vis-à-vis industry,” says Aviral.
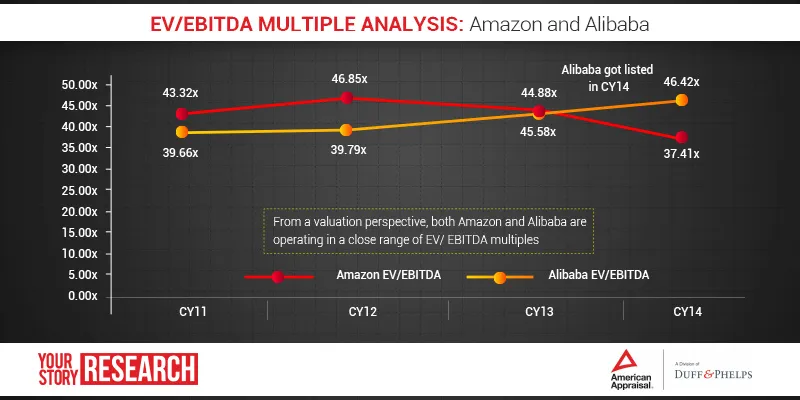
The analysis of enterprise value-to-Ebitda of the two majors shows that they are trending close to each other. This enterprise value-to-Ebitda comparison is important, says Aviral, “For listed companies, analysts typically track the trading profitability multiples of listed companies to understand a stock’s potential for any over- or under-performance vis-à-vis market.”
YourStory’s Take
Coming back to Flipkart and Snapdeal, it will be interesting to see how much more risk capital funding Flipkart and Snapdeal will raise when the GMV multiple is not as attractive. The analysis shows that the growth these two are seeing is stabilising and, as we see with Amazon and Alibaba, finally it all comes down to profits. With both companies getting closer to the stage when a public listing becomes inevitable, profitability and margins will become imperative. So will the two Indian e-commerce biggies finally talk profits?