


Coming out of the closet: Amazon 2.0. Hidden under the hood: Amazon 3.0?

There is much discussion about the consumer internet business model all over the world. Being a flag-bearer of consumer internet, Amazon naturally ends up being discussed. It is amazing that one company generates so many diverse opinions. These discussions prompted me to dive deeper into Amazon’s history and financials. After my analysis, I was surprised to find that while firms inspired by Amazon are trying to implement the Amazon 1.0 model (conventional online commerce) in their respective geographies, Amazon itself has quietly become Amazon 2.0. And this did not even happen very recently, but somewhere around 2010-11. Amazon 2.0 is all about exploring complementary businesses that can enrich its basic online retail platform. More recently, these complementary businesses have moved to the driving seat. In this article, I analyze the impact of Amazon 2.0 from financial and strategic perspectives. I have also attempted to see how some of the initiatives taken in 2015 will impact the future of Amazon.

A very brief history of Amazon: through the lens of finance
Amazon’s transition from an online book-seller to an A-to-Z seller is deeply linked with its financial metrics. I traced these linkages in the very brief history of Amazon. By the end of 2004, Amazon had aced its pure e-commerce business model. In year 2005-06 it started its membership scheme, Amazon Prime, and also started providing fulfillment services to third-party sellers via its ‘Fulfillment by Amazon’ service. In late 2006, it started providing cloud infrastructure via Amazon cloud, which was called AWS. AWS services gained momentum in 2010, when Netflix started using AWS. This created a bandwagon effect. In 2007, it sold first e-reader (Kindle), and in 2009-10, made a decisive launch of various versions of the Kindle. In 2011, it launched Amazon Instant Video, a service which started providing video on-demand. In 2015, it launched Amazon Echo and Amazon Dash to target the ‘Internet of Things’ market.
Amazon’s whole business can be examined from two perspectives: operating margin and cash flow. Since its inception, Amazon has requested to be judged on cash flow. However, as Amazon added more layers in its business (Amazon Prime, third party sellers, fulfillment by Amazon, and AWS), it began expressing operating margin as an indicator to be watched. In 2010, for the first time Amazon formalized the importance of operating margins in its annual report: “We believe that income from operations is a more meaningful measure than gross profit and gross margin, due to the diversity of our product categories and services.”
I have tried to capture the combined effect of these two indicators, cash flow and operating margin, in the metric proposed here. The metric is (Gross Profit + Negative Working Capital)/Opex. We will see the relation of this particular metric with the business models of Amazon 1.0 (pre 2010-11) and Amazon 2.0 (from 2011 till now).
Before dwelling on Amazon 2.0, let us understand why Amazon as an online retailer has a decisive edge over offline retailers like Walmart. Here is the basic premise:
There are three ways to finance day-to-day operation expenditure (Opex) of a company without raising any funds outside of equity:gross profit, negative working capital, and debt. Negative working capital is the difference between current liability and current asset, when adjusted for cash and equivalent. Put simply, negative working capital means suppliers of the business are financing the operations of the business without charging any interest. This arrangement is quite unlike debt financing, where the business needs to pay interest.
For this article, I will not delve into debt since debt is again an outside funding option, and inherently risky. The chart below explains Amazon’s edge over Walmart[1] :
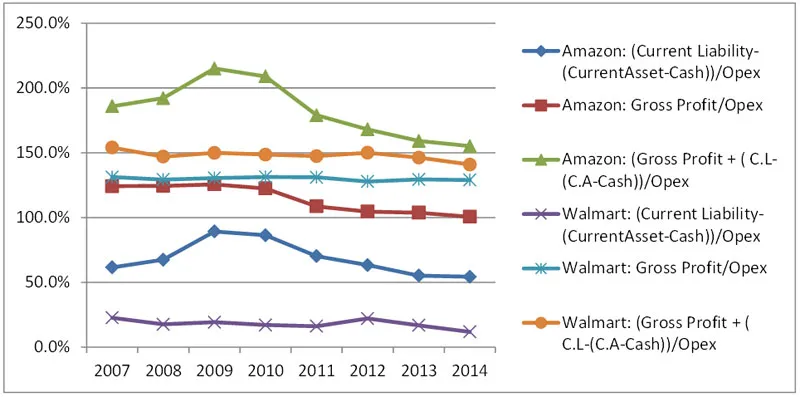
As shown in the chart above, due to its high negative working capital, Amazon has a decisive edge over Walmart. The conclusive metric is (Gross Profit + Negative Working Capital)/Opex (green line representing Amazon and Orange one representing Amazon). Negative working capital is represented by C.A-C.L-Cash. Amazon doesn’t generate as much Gross Profit as Walmart generates, but it more than compensates for this with the high negative working capital generated in its day-to-day operation. In fact, the flow of negative working capital is so strong that it goes beyond managing operating expenditure, and even pays for Amazon’s long term investment decisions. As I explain later in the article, as Amazon fine-tunes its 2.0 strategy, its Gross Profit generating capacity is back.
Tracing the path to Amazon 2.0
The transition to Amazon 2.0 has been slow and gradual. Here are a few charts and data points which explain this transition. Based on these charts, I will also attempt to estimate the impact of some of the recent steps taken by Amazon.
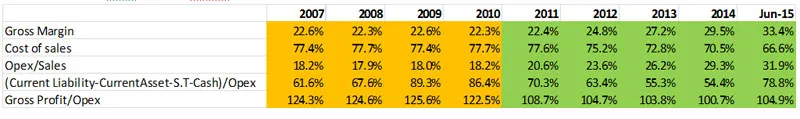
(A) I have chosen data from years 2007 to 2014, and have also included the data of the first six months of 2015, the most recent year. Amazon has transformed into a different company post 2010, as evident by the table below. There is sharp decrease in our chosen metrics of (Gross Profit + Negative Working Capital)/Opex. Negative working capital is represented by C.A-C.L-Cash. This decrease has been aided by decrease in Negative Working Capital/Opex, and a decrease in Gross Profit/Opex.
(B) Amazon surged strongly ahead in the AWS market in late 2010. It transferred all its internal technology to AWS. It gained momentum from Netflix transferring all its server operations to AWS. These steps changed the structure of operating expenditure at Amazon. Now tech & content and fulfillment expenses, including expenses related to AWS processing, has the lion’s share of operating expenditure. Fulfillment costs were also increased by the Fulfillment by Amazon service for third party. But the increase in tech and content costs was largely due to AWS. As shown in the figure below, AWS was the fastest growing contributor to Opex. By 2015, AWS is the biggest contributor to Opex at Amazon.
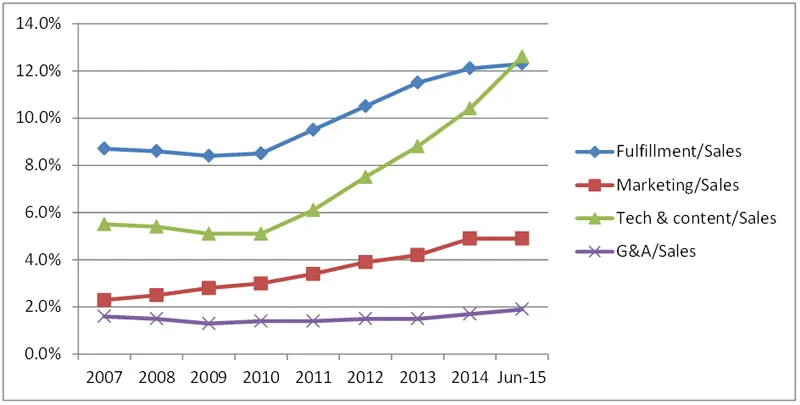
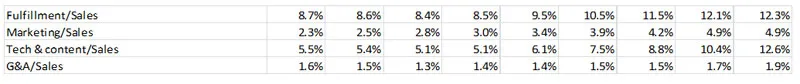
Note the kink in chart for tech & content expense/sales and fulfillment expense/sales in 2011. It appears because in the year 2011, Amazon entered an AWS era; AWS started driving operating expenses.
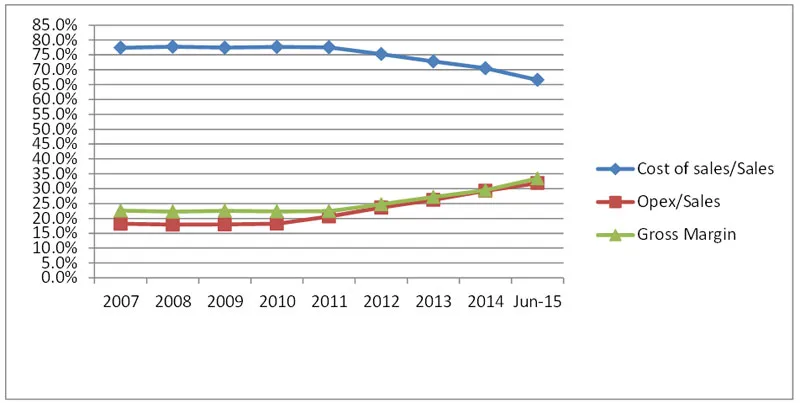
(C) AWS is a higher gross margin (lower cost of sales) business and a higher Opex business. In 2011, that impact started becoming visible in these parameters. Gross Margin was increasing, and Opex/Sales was also increasing. AWS is a business with high operating leverage, and also, high financial leverage. Like any high operating leverage business, it is a business of scale. The more the revenue grows, the stronger the bottom-line becomes. In the first six months of 2015, backed by AWS business results, Amazon finally made enough gross margins to overshoot its operating expenses. Perhaps that was the best time for Amazon to announce its AWS numbers separately.
(D) I had also mentioned earlier that Amazon is working on getting back the ability to finance Opex via gross margin in year 2015. You can also see that effect here in 2015:
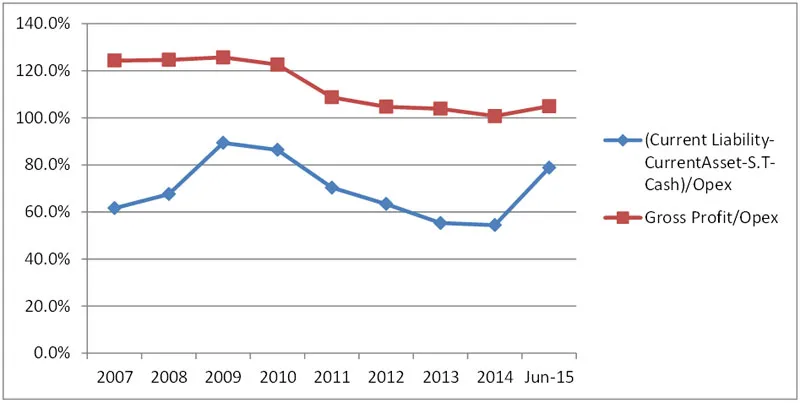
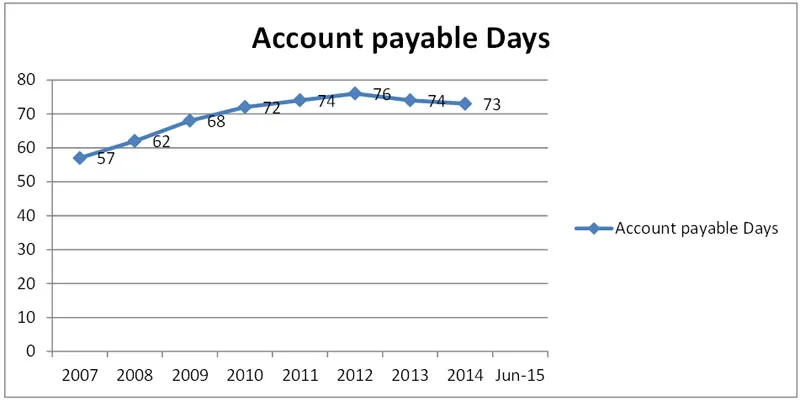
Gross profit was comfortably financing Opex till 2010, and negative working capital was providing great support by financing close to 85% of Opex, at one time. Post 2011, AWS started changing this dynamic. Here till 2007-2010, we also see a rising negative working capital, compared to Opex. That was mainly because of Amazon entering the Kindle business in 2007. Amazon launched many versions of the Kindle in 2009-10, and that shows the highest point of negative working capital. A close look at the number of account payable days confirms this:
After 2010, with the rise of the AWS business and operating expenses related to that, the share of accrued expense (a dependent variable on Operating expense) started increasing in current liability. Another segment, which was showing increase in shares, was unearned revenue (It constitutes revenue generated from Amazon Prime and AWS). Amazon Prime is a business that provides unearned revenue, like AWS, but doesn’t push up operating expense in a similar way. The kink in year 2011 is again visible here.
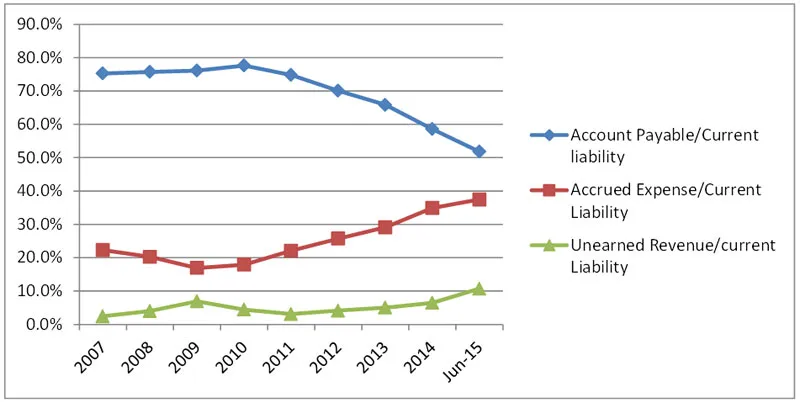
In first half of 2015, we see a huge rise in unearned revenue. As we know, unearned revenue is made up of Amazon Prime subscriptions and AWS prepaid revenue. Amazon increased the Amazon Prime subscription rate from 79 USD to 99 USD in middle of 2014. We can see that effect very visibly here in the Jun 2015 numbers.
Making sense of AWS and Amazon Prime announcements
AWS is similar to a heavy equipment rental business; it has high operating and financial leverage. The one key difference is that the underlying asset in this case, i.e. servers, depreciate faster. They also become obsolete with the genesis of new kinds of technology, and more often than not, similar newer servers come cheaper than the previous ones. At the high pace of technological change these days, the productive life span of a server is between three and five years. I think Amazon’s play book, regarding its AWS and Prime business, is:
- It never lets its server go unused, and builds up scale by being a price leader. Since its inception, Amazon has done 44 price cuts.
- It makes use of uncorrelated servers so that they can remain occupied 24/7. AWS is in more countries than the Amazon retail business. The AWS marketplace is another attempt to keep servers always running.
- It uses this scale to cover the high fixed cost of technology expenses. Once revenue numbers cross the threshold, higher operating leverage ensures more profitability. The whole focus is on increasing AWS asset turnover.
- If servers are not being used, they explore new businesses which can start using their servers. Amazon Instant Video in 2011, and now Amazon Prime Music, look like efforts in that direction.
- Amazon Prime subscribers are basically a household unit. Music is individually consumed; everyone has different taste. They want to increase the number of Amazon Prime subscribers by converting them from household units to individual units, by catering to music consumers. Pandora, Spotify, and other music services have more subscribers compared to Amazon Prime. By reducing their prices, Amazon Prime music is now inciting individuals to adopt Amazon Prime. Amazon Prime subscriptions bring lots of unearned revenue with not that much impact on operating expenses. So, any win in that direction will have a snowball effect.
Amazon is linking AWS business assets with its prime segment. In the process, it is also testing the price elasticity of Prime. It is using a carrot (Amazon Prime Music) and stick (price increase, new household account restrictions) policy to test the waters. Amazon is making hay while the sun shines. AWS business numbers has finally provided it room to link Prime with AWS. This is an aggressive move, but also defensive in a way. AWS business is very much dependent on different kinds of consumer internet companies. If a bubble bursts, AWS will suffer. The best way to save a business from a lot of suffering is for it to have more of its own paid services. Using AWS, which can keep Amazon’s AWS business profitable enough to cover lease payment of these servers, Amazon can do this. Amazon Prime Music and the Prime price increase are steps in that direction.
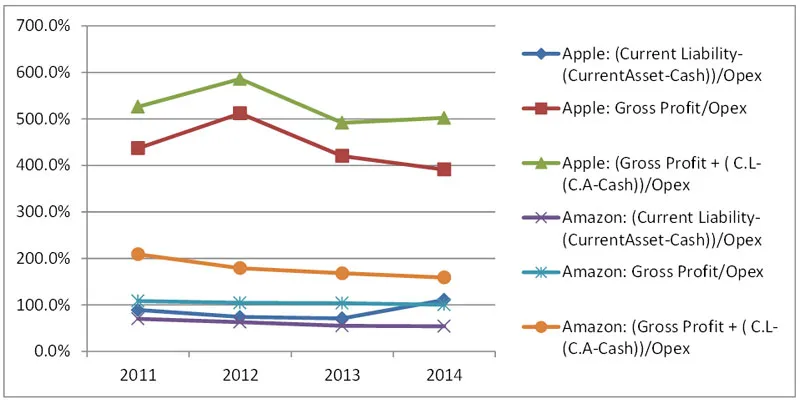
One last thing: the Joker in the pack, IoT: In the year 2015, Amazon launched its Internet of Things (IoT) product in the market (Amazon Echo and Amazon Dash). The impact of launching a successful product is normally an increase in the gross profit margin, with the exception of Kindle. The reason for this was that Amazon never wanted to make money on the Kindle. It wanted to make money on e-book sales rather than device sales. So it was not making any margin on device sales. Make no mistake, though; this time Amazon is targeting device and data both, device via Amazon Echo, and data commerce via Amazon Dash. If Amazon dominates IoT platform businesses in future, and it chooses to make money on devices and data both, we will see more increase in the gross profit margin compared to operating expenditure, and will also see an increase in negative working capital in comparison with operating expenditure. These ratios will start looking like the Apple chart below (Respective Amazon 2.0 era metrics have also been put in chart). Apple dominates the smartphone device market (86% of its revenue in year 2014 came from product sales) and dominating a device market is an unparalleled way to finance day-to-day operating expenditure, where gross profit margins and negative working capital both are in excellent shape compared to operating expenditure. The winner of an IoT platform has a similar future on the horizon. If Amazon is the chosen one, that will certainly be an Amazon 3.0 era. The cornerstone has been laid, with Amazon launching devices for the IoT market. The billion dollar question is when financials will start showing arrival of the Amazon 3.0 era.
[1]Walmart Financial year ends at Jan 31 and Amazon ends at Dec 31. For Apples-to-Apples comparison, I have pushed Walmart data to the end of previous year. For examining trend, this change is not pertinent.