What it takes to be a Smart City? (Part 2)
Taking a cue from Part 1 of the article, we start with the Data Repository Block. The Data Repository Block will be holding all the data that is coming for integration layer as well as the transactions that are being done by citizens, city authorities and enterprises via the portal and mobile layer.
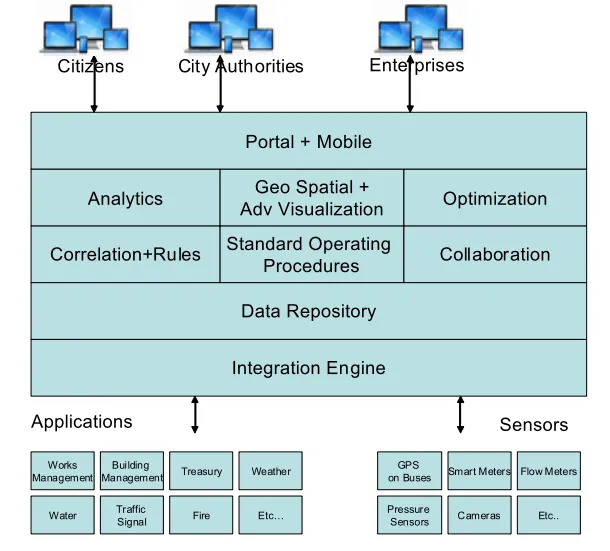
Data Repository can be further broken down into OLTP, OLAP and Content stores. A brief about them (they are topics by themselves, but for the sake of focus I’m keeping it brief).
OLTP Repository: OLTP stands for Online Transaction Processing. As the name suggests it holds all the transaction data for applications. Applications which are into transactions like a Billing application for Energy and Utility company or a Core Banking application for Banks would use OLTP databases.
OLAP Repository:OLAP stands for Online Analytic Processing. These databases are suited for data analysis. Imagine an OLTP database holding more than 1 TB of data with two million records and you are required to run an analysis. A OLTP database or repository typically would not be suited to handle these kinds of queries and this is where an OLAP database is best suited.
Content Repository: This holds all the documents pertaining to the City Operations with the necessary Metatags. Metatags contain information describing the documents. To take a simple example, if there is a Building plan document that is uploaded in the system, there needs to be a mechanism for locating, updating, archiving or deleting it. The information could be a Document ID, Date of creation, Name of the document, Name of the builder etc. This information is called Metatag.If you are still not getting Metatag, not to worry, you can you can move on, as I am not taking its reference in the subsequent sections☺.
We now move to the next block which is the Correlation and the Rules engine.
Correlation Engine: Its purpose is to correlate data coming from disparate sources based on common factors residing in the data. The system should allow setting up the correlation logic.
Rules Engine: As the name suggests, it is a place where the rules are configured. Simple rules like “if” the value of the tax collected is less than x per cent of the total revenue “then” send a notification to the authorities. The system should allow configuration of complex rule sets as well.
Before I sound very geeky let me give an example. Treasury application in a city, holds the budget that is allocated for various activities for a City. One such activity can be new road constructions. Public work application is another application that would have information on the actual road constructed and the money that has been spent on it.
The correlation engine would correlate the budget for the new road construction to the money that has been expensed for the same based on say the road construction project ID (I am putting this case to give an understanding of the correlation, it may vary from city to city based on the applications they use). After the correlation, now using the rules engine it would be possible to configure a rule that if the money that has been expensed in the new road construction is more than x per cent of the budget that has been allocated, then throw an alert.
The next block is the Standard Operating Procedures. This is the workflow engine of the solution. It would be possible to configure the steps to work on a problem (that has come as an alert) or a day to day task notification. To extend the above example of road construction, if an alert comes to the city officer that the expense has gone beyond a certain limit, he would do the first level of investigation and submit an online report to his superior, who in turn can close the case (if the expenses has shot up due to extraneous reasons) or move it for action.
The Collaboration Block, can be used for communicating within city authorities. The Collaboration Engine should support instant messaging, web conferencing and forums. The instant messaging and conferencing facilities enable quick decision making for the City by its several Stakeholders.
Analytics Block is “the block” for city authorities, where they can run reports, dashboards, get key performance indicators (KPIs), analyze the data. Now take a guess; from which repository it would pull in the data? You got it, right! It would be the OLAP repository. Analytics Block need to support diagnostic analytics, descriptive analytics and predictive analytics. A little about them.
Descriptive analytics: This is used for analysing what has happened in the past for an organisation.
Diagnostic analytics: This is used for diagnosing why and how things have happened to an organization.
Predictive analytics: Based on the historical data, predictive analytics would be able to predict the outcome in the future.
To know little more about them with examples, you may go through one of my other article “Analytics to Predictive Analytics”.
The Next Block is Geospatial and Advanced Visualisations. Both help the City Operators in visualizing the city operations, identification of problems associated with them and their mitigation.
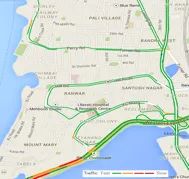
Geospatial: This helps in visualization of the City Operations on top of a Geographical Information System (GIS) map.This Block would overlay the GIS map with information pulled from the analytics, data repository, correlation and rules engine blocks to indicate the overall health of the city operations. This would also be overlaid by alerts and notifications allowing the city authorities to visualise the problem in the right location of the city and accordingly mobilise the right resources in that area. The common examples of the GIS maps are Google Maps and ESRI.
Just to illustrate, what I am referring to, below is an simple example of the traffic situation in an area, interposed on top of a GIS map. Dark red indicates that there is a traffic jam.
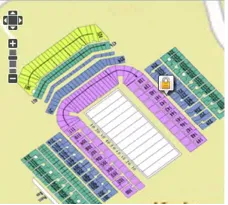
Advanced Visualisations: The above example was for easy visualisation with a city geography. But if authorities want to visualize events inside a building or a stadium, they would need Advanced Visualisation. This solution component would allow pulling in images of buildings, stadium etc and overlay these with events. Below is an example of a stadium image overlaid with an alert notification (eg : overcrowding)
The Optimization Block will calculate optimum value based on constraints imposed. The solution should be flexible enough to define the End goal and Input and the constraints. A simple example for illustration would be for Garbage Management Authorities to decide the route of the Garbage Dumping trucks from different source locations such that they pick up the garbage from the various points, dump in the Dumping ground and return to the source in such a way that length of the route is minimum.
Coming to the last Block now, the Portal and Mobile Solution.
Portal : This component would aggregate the different pieces of analytics, geospatial, advanced visualisation, collaboration, SOPs, alerts (generated out of the correlation and rules engine) in a one single view, with a role-based access. Each solution component would correspond to a portlet (you can think of this is as a mini window) in the portal.
Below is a snapshot of how the portal screen would look. As you can see there are portlets for Dashboard, Geospatial, Collaboration, Analytics, and Alerts.
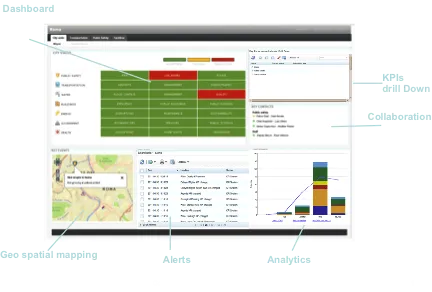
Portal should be able to offer a role based access to the various portlets to the user with the right context. For example the Municipal Commissioner would have a complete view of the city through Dashboards and KPIs. Whereas a health department officer would have access to the Dashboard and KPIs relevant to his department only. It should be possible to restrict access to certain components of the solution based on his or her role. So a health officer would probably see only the Dashboard and KPIs may not see the geo spatial portlet in his access.
Mobile: The importance of mobile cannot be further emphasized in this age, with the rapid growth of mobile usage. This solution component would provide the access of the portal to the citizens of the city, city authorities and enterprises in mobiles and tablets. With the help of this component it would be possible to get the portal pages to mobile and tablet with different form factors (shape and size).
It would also be possible for the city authorities to actively engage with their citizens using push notifications and SMSs. Citizens can report issues (e.g. broken street light) to the authorities through their mobile devices. It would also be possible for city authorities to do the transactions such as filling up the building inspection form in the field itself using a tablet or a mobile and submitting it for review from superior authorities.
This kind of sums up the Solution Architecture for a Smart City.
In the next articles in the series I would be taking use cases related to various aspects of the City, and relate back to Solution Architecture.


