

This is a user generated content for MyStory, a YourStory initiative to enable its community to contribute and have their voices heard. The views and writings here reflect that of the author and not of YourStory.

The Indispensable Time Reports For Efficient Timesheet Management


This is a user generated content for MyStory, a YourStory initiative to enable its community to contribute and have their voices heard. The views and writings here reflect that of the author and not of YourStory.
It’s been said enough how collecting work time data is vital for businesses. The smart use of your timesheets data will reveal important trends in workflow and business processes that you can use for further improvement.
Creating custom reports for your company will help you spot the over- and underperforming teams and employees, eliminate bottlenecks in the workflow and maximize profitability of your projects. Let’s see how to use them for efficient timesheet management.
What is actiTIME reporting?
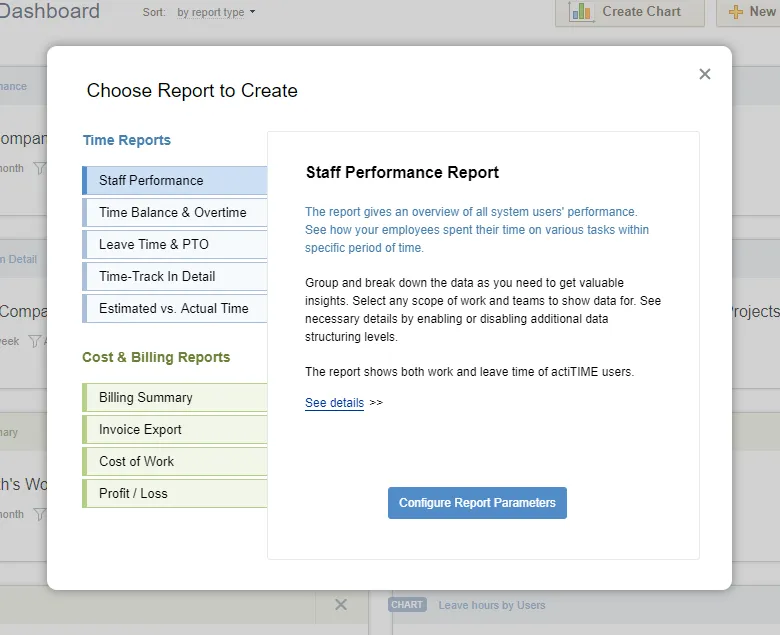
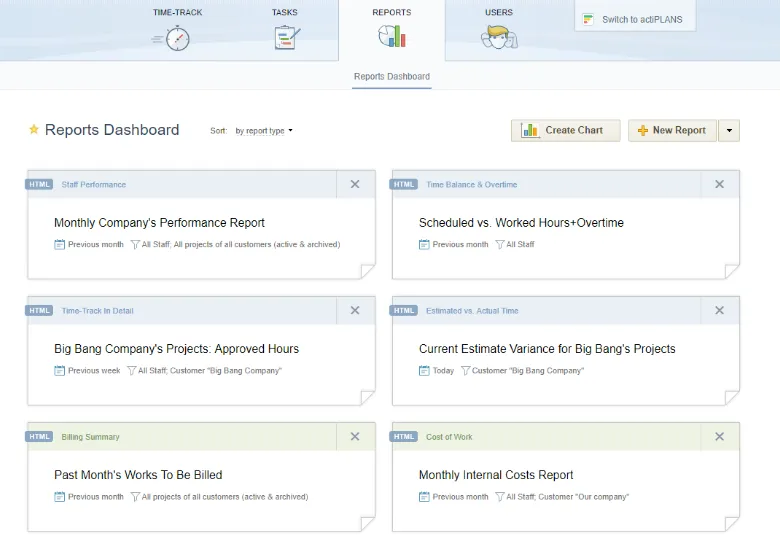
actiTIME provides a multitude of time and billing reports for different level of management. You can find the list of predefined reports in the Reports section:
Within each report you can set a preferred configuration filtering data by projects, teams, time periods, types of work, or other parameters. Save this configuration to your dashboard and run reports you need in one click.
How do actiTIME reports help in timesheet management?
actiTIME reports will be useful for team managers, project managers, HRs, accountants, and business owners. Here we’ll focus on time reports that are helpful for team and project managers in their efforts to work on their teams’ productivity and timely project delivery.
You can choose any specific date range for your reports and compare trends with the same period in the past to get the dynamic picture.
The reports can include all data available to a manager, or only show the data for specific parts of work and teams. They can be exported to CSV for further data processing, or PDF format for printing them out.
Below, we’ve described the most helpful actiTIME reports that provide managers with valuable information on how work time is spent on their teams.
Staff Performance Report
This report provides insights into team’s time spent on various work assignments. Basically, the report allows managers to see who on their team has reported time, on what tasks, and how much time has been logged.
The report gives an overview of team’s time expenses and helps reveal the most time-consuming parts of work. It also provides managers with the information on how much time it takes to perform specific works, which later helps in estimating and planning upcoming project work.
Here’s how to use this report:
- Use from one to three data grouping levels to obtain necessary level of detail;
- Group the data by months, weeks or days to see how much work has been performed by your employees in that time period;
- Group the data by customers or projects to see how much work has been performed for each specific project or customer;
- Group the data by type of work to see what work types take up the most part of time and effort;
- Click on the clickable time entries to see employees’ comments to their time records directly in the report;
- Break down users’ data by departments to see department subtotals, or just for a more convenient data representation.
Time Balance & Overtime Report
This report is designed to provide managers with the information how time actually spent by the employees relates to their scheduled time. If you’re keeping track of overtime, the report also shows how much overtime each employee has accumulated.
This report can be used to figure out employees and teams who are overloaded or have insufficient workload, and see what tasks they are performing. It also provides information for calculating overtime compensation, if the employees are paid for overtime at a higher rate.
Here’s how to use the report:
- Group the data by users or departments to see scheduled vs. actually worked time for each employee or within each department;
- Group the data by months, weeks or days to see overtime accumulated for that period, and later use it for payroll calculation;
- Select to show both time balance and overtime, or only one of these parameters to avoid excessive details in the report;
- Configure the report to show work and leave time in separate columns to see time data in necessary detail.
Leave Time & Balances Report
This report is used by team managers, HR and accountants to manage absences on the team. The report provides managers with the information on who’s been absent on specific period of time, and how it has affected their paid time-off and sick days balances.
The report can be used to include paid leave data into payroll calculation, analyze team members’ absences, and detect and manage absenteeism issues (if any). One more important use case is handling unplanned absences: collecting the data and seeing the dynamics helps make unscheduled absences more predictable and better plan work for future.
Here’s how to use the report:
- Group the data by users or departments to see individual and team’s absence data for any specific period;
- Group the data by months, weeks or days to see absence totals for those periods and reveal absence dynamics;
- Run the reports for all leave types or only for specific ones: for example, running a report for less predictable leaves (usually sick leaves are the case) provides insights into unplanned absences on the team;
- Configure the report to show leave time, paid time-off and sick days balances, or just any of these parameters to prevent information overload.
Time-Track In Detail Report
This report provides team and project managers with totals and details on how work has been performed within the selected date range. Its rich configuration options allow to set up necessary levels of detail, group the data in many different ways, and get the most value out of timesheet data.
The report is used to analyze teams’ and team members’ performance, identify the most time-demanding parts of work, and delve into detail to thoroughly analyze the work process. One of its most helpful features is users’ comments included directly in the report: this helps reveal specific aspects of employees’ work on their tasks, identify difficulties that they’ve encountered, and figure out where’s room for improvement.
Here’s how to use the report:
- Use report data in the raw form for export and further processing;
- Select from one to three data grouping levels to obtain necessary level of detail;
- Join comments by tasks to get insights into specific work process details;
- Group the data by project and task names to get subtotals for similar parts of work;
- Group the data by types of work to identify the most time-consuming parts in the work process;
- Group the data by users and departments to see and analyze individual and teams’ results;
- Group the data by customers and projects to see totals and details for them.
Estimated vs. Actual Time Report
This report is one of the most helpful tools for planning and forecasting. It provides project managers with the data on the proportion between planned and actually worked hours for each customer, project, or task. The report shows the variance between the estimate and actual time in man-hours and in percentage value.
Running this report after each completed part of work helps managers understand where their estimates were exceeded, and improve estimation technique for future work. Actual time data for typical tasks can be used later when planning and estimating similar work – with necessary adjustments.
Here’s how to use this report:
- Configure the report to show time variance as of today or any date in the past;
- Use up to four data grouping levels to obtain necessary level of detail in the report;
- Run the report for task with both open and completed statuses, or for any specific status only;
- Include estimates of tasks that are not started yet to get the complete picture;
- Include time data for tasks without estimates to see how much time they take up and use this data in future planning.
Billing Summary Report
This report works for project managers and accountants. It provides them with the data on how much customers should be billed for work performed by the company’s teams. The data can be used for invoicing, or exported from actiTIME for processing in accounting systems.
Here’s how to use the report:
- Configure the report to count the data for all work performed within the selected date range, or only for tasks completed within the selected date range – depending on how you’re billing your customers;
- Use up to three data grouping levels to see the data in necessary detail;
- Set up the report to show both approved or not approved time-track, or approved time only, depending on whether billing for performed work depends on approval or not;
- Include time data of non-billable task to get the full picture;
- Include in the report both billable time and billable amounts, or billable amounts only.
What about regular users?
Regular users who don’t have any management privileges in actiTIME are also able to run time reports with their own data only. They can use the reports to analyze their performance and time management results, optimize their workflow, and work on their productivity.
Also, each actiTIME user who can record their time has access to their own time-track summary. It is available on the View Time-Track page:
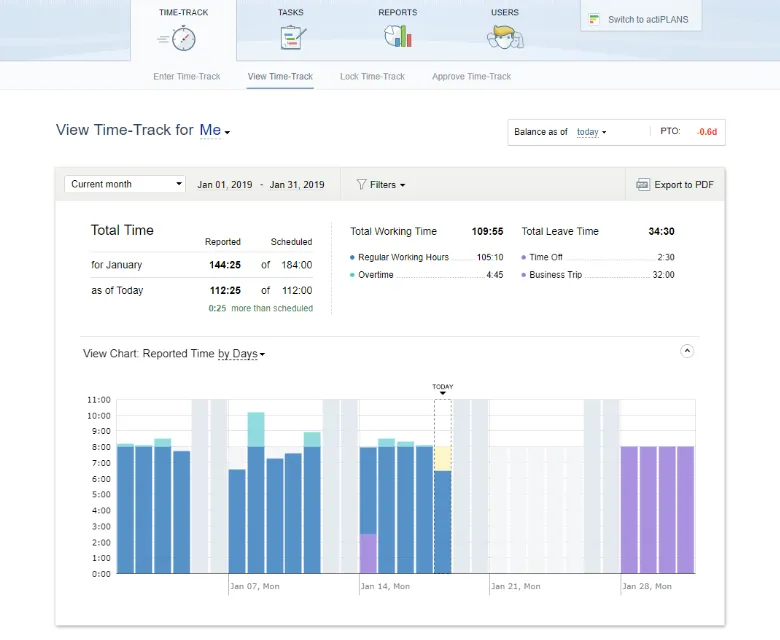
This interface provides the user with general data on how much of the scheduled time has been worked, how much absences and work time have taken, and what exactly has been accomplished within the selected date range. actiTIME shows this data in an informative table and in a colorful chart, and allows to export the data to PDF format.
Summary
Timesheet data is a valuable source of information to see if your team uses their time efficiently. Informative and flexible reports provided by actiTIME provide managers, accountants, HR and business owners with vital information on how work is performed.
The data obtained in the reports allows to analyze teams’ performance, improve management technique, and see where’s room for improvement and optimization. Regular users can use their timesheet data for work on productivity and optimization of their workflow and daily routine – actiTIME provides helpful reporting options for that.