5 tools non techies can use to manage data
When it comes to startups, dealing with data is an integral task. But most of us aren't qualified to deal with huge data sets. To help you manage data better, we bring you tools which can make your task easy.

Open Refine - Most datasets consist of inconsistencies and errors which are needed to be cleaned before use. Data errors can be caused due to different date formats used for the same day, typing errors made during data entry or just extra spaces where there shouldn't be any. Spreadsheets can have duplicate entries, or entries that should be split into two (or more) entries. These can be hard to find. These can be a one-offs problem, or can span across the entire dataset, such as spelling a person’s name or location differently each time. Finding and correcting these by hand is time consuming and comes with the risk of making new errors when trying to correct the old ones. Open Refine highlights the possible errors and helps fix the problems across the entire dataset. It also helps in re-structuring and re-formatting data and merging data with other datasets apart from translating the data into other languages.
Yahoo Pipes - Yahoo Pipes offers a very wide range of tools to mix and modify data, from very basic to advanced. The filters are particularly impressive. You can create a pipe to either define the filters at the initial stage or allow users to enter their own search terms through a form. Filters can include words, locations, latitude and longitude, regular expressions and many more. One of the great things about Yahoo Pipes is that you can take feeds from multiple sources, merge them into one and then filter and use the results for any application which accepts data feeds.
Google Fusion Tables - One of the best tools for visualization for the non techies. Just upload or link to your data source and leave everything to Google Fusion. This tool is still under experiment and is available under Google Labs. You can create different kinds of charts and graphs with it. It also lets you create maps by automatically scanning your dataset for location data and geocodes it accordingly to point on the map, without any intervention.

D3JS - Though D3JS is primarily for techies, it deserves a mention as it is the best and most widely used visualization library available free of cost. D3 is a JavaScript library which stands for ‘Data-Driven Documents’. It can be used to create diverse creative charts, diagrams and maps which can be embedded anywhere on your site. D3 has a steep learning curve and is most preferred by techies.
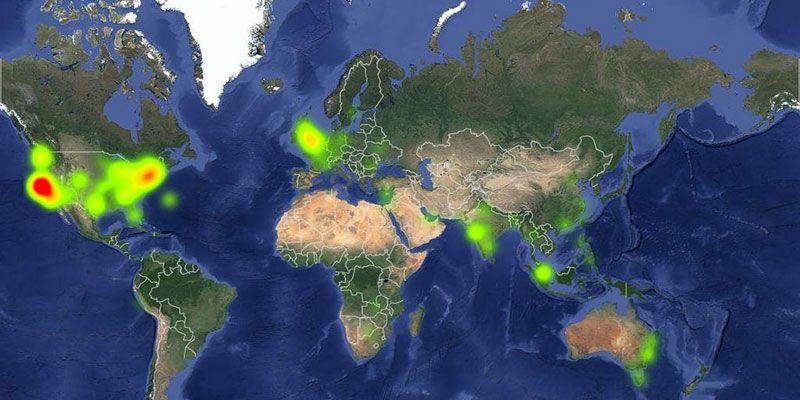
Open Heat Maps - You can create static maps and interactive animated maps which enable people to see data visualizations change over time. You can map any dataset that is linked to an array of locations such as IP addresses, street addresses and longitude and latitude coordinates. You can upload spreadsheets from Excel or use Google docs as well. The best part is that it can handle multiple plot points by blurring them into larger points if they are close to illustrate particular concentrations in certain locations.
Which tools do you use to handle your data, tell us?