Cohorts to LTV, CAC to MAU: Tips to make it meaningful, avoid Vanity

We keep hearing about a lot of growth metrics all around us, but ever wondered, if all that ever made sense? Learn what real, meaningful metrics are & use them to drive real growth.
Here are some of the popular terms which can be termed as Vanity if not reported rightly:
Install Base — Barring highlighting the Install buckets milestones (check the note), there is no point in dwelling on the install base as we all know how most Apps are grappling with over 70% uninstall rates. Net Install base any one?
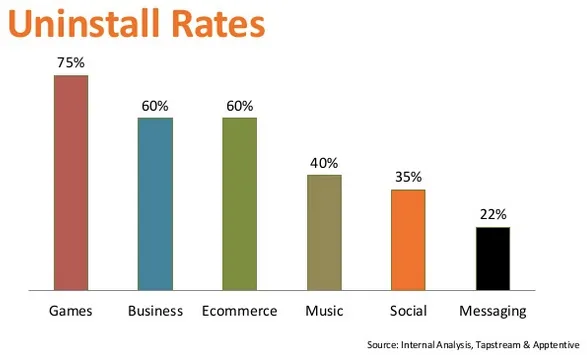
Average uninstall rates for Play Store for various categories
Active Users — Happy to see that active user is now the widely used metric than awfully flawed Install Base. However, how you define an active is important too. For example a chat app highlighting MAUs is a clear eyewash when companies like Snapchat are taking about HAU (hourly active users). MAU is losing relevance for most apps, so stick to short durations if you really want all of us to believe your great numbers. (Here is a great hack to find MAUs for most apps)
Retained Users — If you spend consistently on acquiring new users which leads to an overall increase in MAUs, it will an incomplete analysis if the overall MAU % is the only metric you track. It can be a bit misleading as you may fail to notice the actual leak in users. A good analytics person will measure the growth of increase in active users minus the new users acquired that month.
Here is a sample illustration on arriving at Retained user’s growth:

So in reality, the retention is not as great as being projected in Active % growth
Category Rank — Yet another “How cool we are” metric. It’s useless unless you are visible in Top 25 overall Apps. For example, in India Play Store (as of 30/9/2015):
- 1 Sports App = No.206 overall Free
- 1 Business App = No.168 overall
- 1 Medical App = No.100 overall
- 1 in Books & Reference = No.109 overall
- 1 Finance App = No.71 overall
So prepared to be judged if you boast about high category rank. Is your app among top 5 sports Apps of India? ;)
Trending Apps — It’s another myth and a favorite flaunting badge for some marketers. It means nothing to appear in trending if you are not in Top 100 overall. For example, in India Play Store, out of top 25 trending apps, only 7 are visible in Top 100 overall free and almost 90% apps never make it to Top 50.
Monthly Retention — Cohorts are often discussed among growth hackers as the definitive way to assess the App’s health. However, it is extremely important to understand what not to quote. For example, Week 8 retention is different from Month 2 retention. Month 2 in all probability will show a much higher retention as it would even count someone who must have visited the app 29 days ago.
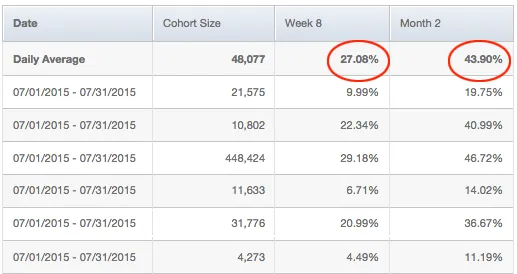
Difference in retention rates between Week 8 & Month 2 for same data
CPI — It’s another term which is quite popular among marketers. I have hardly interviewed any product/business/marketing person who didn’t boast about how they went about optimizing CPIs. Think again — is low CPI a good benchmark? For a news app, it is easy to get installs by showing attractive looking Bollywood pics in its Facebook/Google Ad — will the user acquired by such misleading Ad likely to stay active? So please move to CPaU (Cost Per Active user model)

Real CAC — Next step after CPaU is to find CAC which sets the basis of any marketing campaign. CAC traditionally is calculated by dividing the total marketing budget by converting users. However, with lucrative discounts being offered to acquire new users, the amount of discount needs to form a part of your acquisition cost to arrive at rCAC
LTV or LNP — Lifetime Value of a User is an important metric to allow a marketer to continue spends as long as CAC < LTV. Real Growth Marketer would go one step extra by measuring Lifetime Net Profit of a user to ascertain if the startup would ever make profits from the users they acquire thru marketing. Below is a dummy illustration to show how Real CAC & LNP Ratios should be calculated:

CTR or CVR — Marketer loves to boast about CTRs (Click-thru) as it highlights the quality of creative used but did it result in your app download? Banner might be enticing enough to click but not useful enough for someone to download the App. This brings the concept of CVR (Conversion Ratio from Click to Download) — click leading to an app download is the real measure of campaign’s success. Facebook optimizes campaigns based on conversions under oCPM and CVR plays a direct role in lowering CPCs (despite fixed CTRs) thus reducing the Cost Per Install.
Hence a true Growth hacker would focus on increasing CVR for their App campaigns.
Based on two campaigns delivering varying CVR & constant CTR in Facebook
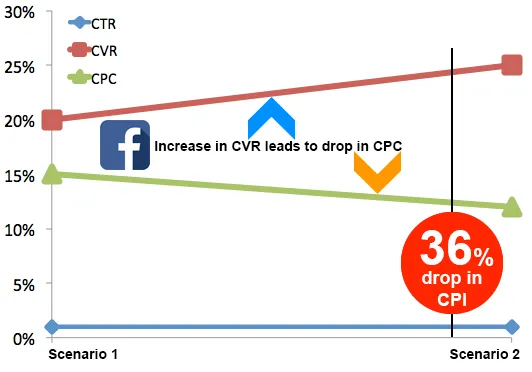
Play Store recently made available a new report which makes calculating CVR much easier.
Qualified Visitor — Lots of Apps rely on push/email/social marketing which can bring in hoards of visitors. Counting all visitors as equal is not advisable. For example, in the image below, how many visitors would you treat as “Qualified” — 23mn or 30mn?
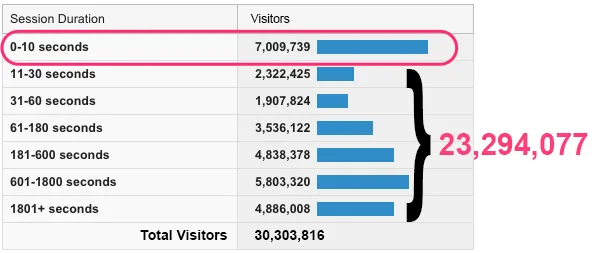
Stop counting visitors who are not technically not interested in your product
The real growth hackers are the ones who are true to themselves and don’t cave in to pressure of tweaking the data to make everyone happy. So if you are one and follow all of the above metrics truthfully, then accept a high five from me. Cheers!
I will be happy to hear your feedback on this. Feel free to comment here or tag me on twitter @deepakabbot or mail me at [email protected]
