
Seven disruptive trends to watch out for in analytics in 2017
There has been a stratospheric explosion of new data platforms, data sources, streaming APIs, data visualization tools, data science toolkits, literally anything related to data. Yet, it’s about to get more crowded.


Every time someone’s asked me how to break into the field of data, I’ve had to take a step back and first check to ensure that I myself have not exceeded my expiration date with regards to constantly upgrading my knowledge pool and analytics toolbox. The industry and market are at their arguably hottest points right now and nobody should be comfortable sitting on their bottom and not be worried about becoming the next dinosaur. I find myself having to upgrade my recommendations every couple of months in order to accommodate the newest technologies that emerge in the market. Heck, in this era the shiny flagship data product that launched two years ago could already be on it’s way to getting phased out by it’s main user base. The analytics applications on our computers today could be replaced in a few months by something that works more efficiently, costs less, and fosters greater team collaboration.
Open source technologies, data sources, platforms, and people’s skillsets are constantly evolving. This is why the advice I offer to candidates looking from the outside is to get their hands and feet wet with data. It’s that simple, there is no better way to start than to take the plunge and get the first-hand experience. Gone are the days where stacked resumes containing keywords such as “SQL”, “Hadoop”, “Tableau”, “R” would guarantee you the hottest jobs. These skills are all too ephemeral and any single one could become the next culprit on the journey to irrelevancy. Therefore, investing a great amount of time learning a “hot” skill can be dangerous.
“Getting started with data” simply means getting familiar with the data that you are passionately interested in (could be stock market trends, sports box scores, political viewpoints, music/movies/entertainment, social behaviors, etc.) and getting in touch with domain knowledge experts or other people who share the same thirst for knowledge. Explore, discover, and collaborate — you might be pleasantly surprised with what you find.
The 7 Analytics Trends of 2017 in this article are predictions of where the industry is headed, but as discussed above, in this field “hot” trends cool off sooner than you would know.
1. It’s about to get more crowded
There has been a stratospheric explosion of new data platforms, data sources, streaming APIs, data visualization tools, data science toolkits, literally anything related to data. Yet, it’s about to get more crowded.
Data is ubiquitous. There’s no one-size-fits-all solution across all industries. In fact, every team in a modern organization has their own embedded analysts and a data stack customized for their needs. Accordingly, every data product in the market is designed with different focus-areas and trade-offs.
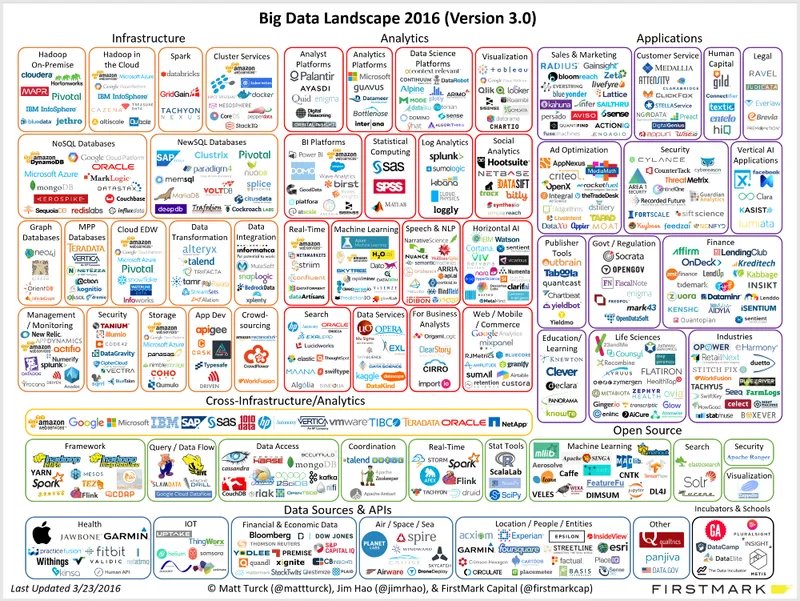
Source: http://mattturck.com/big-data-landscape-2016-v18-final/
While the incumbent business intelligence tools like Tableau, MicroStrategy, Qlik, Spotfire and Domo have been around for 10+ years, we are now spoiled with far too many choices. The “big companies” joined the bandwagon by cloning the incumbents — Microsoft launched PowerBI, Amazon launched QuickSight, and Google launched Data Studio. While these offerings are priced at 1/10th the cost of incumbents, they’ll drag you back to the old enterprise era of “locking in their ecosystem”. Feature parity is a constant struggle for such tools as they’re perpetually playing catch-up with companies like Tableau and Microstrategy (whose exclusive focus is to build data products). The party isn’t over as there are an increasing number of disruptors like Looker, ChartIO, Plotly, Periscope Data challenging the status quo, and at the same time fighting to gain prominence in the crowded market.
Not long ago did Hadoop promise to establish itself as the data warehousing standard, by displacing relational database solutions. This was followed by a multitude of SQL layers built on top of Hadoop, as the business-friendly query language does not seem to be going away in the foreseeable future. However, more recently, Amazon Redshift has been outpacing Hadoop and reinforcing its position as the top choice for data-warehousing. As per Airbnb’s study, Redshift is 4x cheaper and 5x faster, when compared to Hadoop. Modern data exploration products like Graphiti and Periscope Data leverage Redshift’s powerful data processing and complement it with rich features for specialized analytic jobs.
Engineering-rich companies like AirBnb and Facebook are constantly developing in-house data products and making them available as open-source software. Luigi, Azkaban, Oozie and Airbnb’s Airflow are some good examples of open-source workflow managers. Kibana and Metabase are open-source tools offering bare minimum data visualization capabilities, if your organization has the time and resources to manage the infrastructure and maintenance overhead.
This wave is here to stay. We will see new products rise, thrive, fade-out, and eventually be superseded by newer products. Overall, the giant pool of options is going to make decision making harder for organizational data leaders.
2. Integrations and Real-time Ingestions
“Buy vs Build” is a question that pesters engineering organizations in today’s firms. Tech companies especially tend to cook a lot of advanced data engineering on their back-burners. Hence, there is a natural tendency to build everything in-house. If there’s one thing you shouldn’t think twice about, it’s integrations!
APIs are getting a lot of attention and attracting the “non-technical” audiences as opposed to earlier days when it solely appealed to software developers. APIs are widely loved because they’re lightweight, powerfully customizable, and pluggable from virtually anywhere.
With an ever increasing number of data sources, data platforms, data formats, applications and APIs, it is becoming an obvious decision to invest in robust integration and ingestion products that ensure data flows seamlessly between disparate systems.
Trying to build integrations may seem easy at first but you’ll soon get caught up with the maintenance overhead in trying to keep up with a swarm of new as well as legacy products to integrate with.
This is where organizations are finding it wise to buy off-the-shelf products like Segment for API based integrations and Streamsets for their powerful real-time data ingestion and transformation. Astronomer also tries to stay in the game by offering high-level clickstream to analytics but doesn’t quite make the cut, especially when compared to the lowest-level flexibility and control offered by Streamsets.
3. Governance is Back!
The eruption of a wide variety of data technologies, tools and platforms have caused organizational data assets to be as chaotically scattered as ever. This makes data governance not just ripe for a comeback, but a major disruption.
Data Governance is like enterprise documentation — everyone wants to reap the benefits of it but no one has time to sow the seeds. Everyone understands the value of it but no one prioritizes it.
As Timo Elliot of SAP puts in simple terms, data governance is “stopping people from doing stupid things with data”. “Stupid” is a broad term. Stupid could be placing sensitive data in the wrong hands. Stupid could be using the wrong dataset or formulating an incorrect logic. Stupid could be duplicating work that has already been done before. Stupid could mean accessing a stale version of a data asset. Stupid could be showing people what they’re least interested in. Stupid is having no clear ownership of your data assets.
Collibra, an older player now, has become synonymous with data governance. Collibra takes a process oriented approach to data governance, by enforcing best practices, policies & rules and ensuring compliance. It is a product primarily sold to Chief Data Officers at traditional enterprises. Whereas, the new kid on the block, Alation takes a product approach to data governance with automation and machine-generated suggestions that graduates users from being stupid to being smart.
Graphiti marries the two approaches by offering intelligent recommendations but places the power in the hands of data stewards. At the end of the day, experts would agree that successful data governance is part-process and part-automation.
These contemporary data governance products are targeted towards data stewards, business intelligence managers & directors in modern organizations.
4. Stop Waiting. Start Discovering.
How easy is it to search for answers to your questions on Google? And, how easy is it find your favorite article on Medium, the restaurant you’re looking for on Yelp, and that piece of art you didn’t know how to search for on Pinterest? Easy, right?
Have you wondered why it’s so hard to find answers to your data questions within your organization? Why is it so hard to find the data asset you’re looking for vs. the one you should be looking for?
Well, this is not a new idea. The promise of “Self Service BI” has been over-sold by business intelligence vendors since the 1980s. The ambitious, yet empty promises caused mistrust amongst many business users who now feel cheated because their reliance on data engineers and analysts never end. The so-called self-service tools have not solved the chronic bottlenecks. The ever increasing backlog of data requests aggravates the wait time in queues, often causing business leaders to ask less data questions and hence, rely more on intuition. The persisting pain points make it an area where we will see technology leapfrog in the next few years.
Thoughtspot paved the way with an ambitious attempt of being the “Google for Data”, followed by Statsbot that makes you feel like you’re conversing with a virtual data engineer on a chatting platform. Both these products allow business users to query data using the everyday English language. These solutions empower business users to find answers to basic data queries. We have a long way to go for machines to answer more advanced data questions given the complexities and intricacies that are currently handled by data stewards behind the scenes.
If Statsbot and Thoughtspot act as the Google for data, then Alation and Graphiti act as the Amazon, Yelp and Pinterest for data in your organization. While Statsbot and Thoughtspot address discovery of business questions at a micro level, Graphiti and Alation address the macro problem of data asset discovery. Alation brands itself as a data catalog, with primary focus on finding the correct datasets and columns in those datasets, based on metadata and user engagement patterns. Graphiti goes a step further and attempts to make the entire spectrum of organizational data assets easily discoverable — whether it SQL queries, datasets, dashboards, R scripts, data connections and pipelines — by assigning every asset a discoverability score and visually graphing how assets are related to each other.
5. Collaboration
It’s 2017 and the world is as connected as ever. You must be living under a rock (and without an internet connection) if you need to be convinced about the powers of collaboration. Whether it’s minimizing duplicate work, fostering knowledge sharing, or simply allowing individuals to bring out their very best — collaboration is the ingredient that enables 1 + 1 > 2.
Google Drive and Quip enabled collaboration of documents, UXPin and Figma did it for design, Github and Bitbucket for software engineering, and Slack for communication. Imagine how life was back when Google Docs didn’t exist. We would all work “together” on a project using local text editors on our personal computers. Did that work? Sure, but was it efficient? Nope. Human beings seemingly always find workarounds in inefficient situations. When MS Word used to be the only go-to text editor, each person in a team would write their own pieces in separate docs and then there would be a “collaboration” session to cobble everything together in order to put the final stamp of completion.
Imagine how life would have been for software developers if Git didn’t exist. Would it be advisable to maintain separate folders named “Codebase_Mike”, “Codebase_Gary”, “Codebase_Sheryll”? Once you have experienced an efficient state, you never want to go back.
So, why shouldn’t data citizens be able to collaborate? As of today, it’s really inconvenient to collaborate with fellow colleagues on data projects. One data expert typically does not possess universal knowledge of software engineering, data visualization, statistics, and business domain expertise. The nature of the workflow is such that these people work in a linear fashion and end up doing the same things over and over across each vertical, with different results. If an organization’s data generalists and specialists could work together without duplicating each other’s work and create a library of nimble reusable components, companies could achieve a lot more with their data.
Everyday, organizations produce more data and more business questions, requiring more analysis time. Saving time becomes a paramount priority if managers intend to streamline their data projects. Organizations can gain from cross-pollination of differing approaches to problem solving by empowering their team players to collaborate.
In the upcoming years, collaboration will finally unleash it’s full potential, similar to what Google Drive and Github have done for their respective industries. The main purpose of data collaboration is to break people out of their silos, enable working together on the same digital canvas, regardless of where they are located, and in real-time. Collaboration creates efficiency and brings visibility into what others are working on. Up until now, collaboration has largely been limited to commenting capabilities by legacy data products. Graphiti is pioneering an ambitious bet by offering the tools for data teams to reduce friction and collaborate seamlessly. Graphiti promises a future with game-changing productivity improvements by connecting the dots between humans and technology.
6. Data Science Without Code
There’s no doubt that Data Scientists have become the one of the most sought after jobs in the world. The hype is real. It really is.
Data science is huge. However, the market for data science products isn’t. Yet. There are only so many data scientists by training.
You shouldn’t expect a giant spike in Math & Stats PhDs graduating with a specialization in data science over the next few years. Instead, we should see a growing trend in data science products being democratized across techno-functional earthlings.
Over the years, expect the hardcore data science products to grow their market by targeting Excel and SQL users of today. The current user behavior of importing various Python and R libraries and then calling functions with minimal customizations would be reproduced in the form of drag and drop GUI tools.
This would be a huge step in achieving a much wider spread of data science across an organization by empowering people with minimal understanding of algorithms to start doing predictive modeling. At the same time, it does pose a risk of giving a scary amount of technical decision making power in the hands of wannabe statisticians. While it’s fascinating to imagine creating complex statistical models using simple drag and drop interfaces, an insufficient understanding of the fundamentals of what goes behind the scenes can lead to incorrect inferences.
Although this trend is currently at its infant stage, it’s already gaining traction with new products marching in this direction.
Civis Analytics is taking big strides by automating expensive processes in large scale pattern-finding using drag and drop data science features. Dataiku DSS provides a visual UI for users to leverage the latest state-of-the-art machine learning libraries: Scikit-Learn, MLlib, XGboost. Another machine-learning driven product, DataRobot, lets users perform predictive analytics through a few button clicks to automate the laborious math and coding components of data science.
DataRPM, with its impressive data science platform, offers advanced predictive analytics capabilities on industrial IoT data using easy-to-use GUI that requires no coding. However, savvy users can build enhancements on top of the code generated by the UI functionalities.
In the next 5 years, we’re going to see a larger suite of GUI driven data science tools emerge.
7. Hello SaaS
Despite widespread adoption of SaaS products by both SMBs and large enterprises, the hesitation around adopting SaaS products for data or business intelligence tools has lingered. Businesses no longer need to be educated about the benefits of SaaS vs on-premise solutions.
The idea of storing your company’s customer, security, finance, HR, or any other internal data on “someone else’s cloud” frightens Information Security teams. Until recently, most organizations have relied on on-premise deployments as they are anxious about exposing company metrics outside trusted corporate data centers.
The incumbent players have historically offered on-premise solutions with annual lock-in contracts, costing customers anywhere between $50,000 to $200,000.
Only recently have we seen some love towards SaaS based business intelligence products with the emergence of ChartIO, Looker, and Periscope Data. All of these products providing business intelligence on the cloud infrastructure have successfully secured hundreds of customers which goes to show that there is indeed a growing acceptance and market for cloud-based horizontal BI solutions.
The benefits of SaaS solutions for organizations are plenty:
1. the product can be accessed from any geographic location
2. organizational decision-making on buying a tool is drastically faster
3. products can be experimented with no long-term commitments
4. new features are produced a lot more frequently
5. pricing is more flexible
6. support and maintenance overhead is nearly zero
As all modern businesses strive to be lean and agile, the incumbent product vendors will need to change their focus from “locking customers in” to offering flexible SaaS solutions. Otherwise, they are the next candidates to become dinosaurs.
About The Authors
The article is a collaboration between Akash Mukherjee, co-founder of Graphiti XYZ, and Chen Chang, Business Intelligence Lead at Facebook.