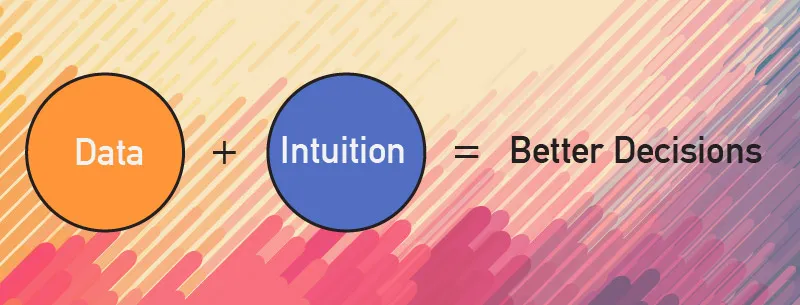
Intuition versus analytics: the dilemma and the balance
It is very important to be data-driven. Decisions are generally better when they’re based on numbers. But divorce common sense and native business savvy from data and what you have is an organisation that is engaging in wasteful activity and taking totally wrong decisions.
There is no better way to illustrate this than with an interesting story and a question: Doctors have identified a new disease in a population. The patient can be saved if the disease is detected early. A scientist has recently come up with a test that can detect the disease. However, the test has a small error rate. If a person does not suffer from the disease, the test would report one in a hundred times that the person does suffer from the disease (i.e. a 1 percent probability of a false positive). However, if a person suffers from the disease, the test would report without error that the person does in fact suffer from the disease (i.e. zero chance of a false negative). It is a relatively low error rate. Now let’s assume that you go through the test and you test positive. Should you worry?

You would reason that since the error rate is just one in a hundred, there is a 99 percent probability that you do suffer from the disease.
Seems perfect, but there is a not-so-obvious fatal fallacy in the thought process. Let’s assume you are told that only one in a million in the population suffers from the disease. So, if this test is imparted to a million people, then 10,000 people would show up as having the disease (1 percent probability of a false positive), but in reality, only one person has the disease. So, the probability that you are the one in 10,000 people is really 1 divided by 10,000, which is very small. Your perspective would change completely with this additional data point about the prevalence of the disease in the population. So, for the test to be really effective, its error rate must be much better than the prevalence of the disease in the population. In this case, the error rate is 10,000 times worse than the prevalence. So the test is meaningless even though it may sound good, especially if the prevalence data is not disclosed.
Yet, it was sufficient to have you worried in the beginning.
Take an example: data crunching from social media and other publicly available data can predict with some accuracy that a particular courier delivery person could commit a crime at a customer’s place. It sounds interesting and helpful. You need to answer two questions before paying for a service like this. What is the error rate of this prediction? How does this compare with the probability that someone in the population would generally commit a crime? If the error rate is one in ten and the prevalence of crime (from past data) is one in a thousand, you now know what to do!
The same is true with some of the claims being made in big data, analytics and artificial intelligence (AI). On the face of it what they recommend based on extensive churning of data seems very clever, logical and credible. But in reality, if you introduce the equivalent of ‘prevalence’ from the earlier example, many of the claims fall flat.
Quant analysis in the capital markets is dominated by PhDs in Statistics and Mathematics. Has the quality of investment decisions been any better because of this? The jury is out on that, but my own view is that it’s no better than before. Take the way risk is measured – the standard deviation in the price of a security (say, a stock) is used as a measure of risk. The price variation is assumed to be a ‘normal distribution’. Price variation of a stock is not a normal distribution, and standard deviation is not risk! Clearly, what is measurable is used as a surrogate irrespective of whether or not it is a true reflection of risk. To drive home the point, it is like assuming that the IQ of a person is determined by the person’s weight and then modeling everything based on this assumption. You can imagine the quality of recommendations using such a model.
Risk modeling is no better, but since most people do not understand standard deviations and normal distributions, they tend to fall for this mumbo jumbo. The trading strategies employed by LTCM, the fund that Nobel laureates Robert Cox Merton and Myron Scholes set up to create value by using sophisticated mathematical models resulted in the fund going belly up in less than four years, whereas Berkshire Hathaway continues to do well! Measuring something using an irrelevant surrogate because it is easy to measure is far worse than using an intuitive assessment even if it cannot be easily quantified.
Another common wasteful activity that organisations engage in is trying to refine assumptions and calculations even where refinement does not necessarily yield better results. Business planning and strategy sessions can therefore end up as wasteful exercises in endless versions of number crunching rather than real business planning or strategy. A forecast is a forecast, especially if there are several unknowns in the mix. Using the latest data to modify plans and create continuous noise and distraction instead of focusing on the fundamentally right things to drive is a waste. I have seen umpteen meetings where a lot of time is devoted to creating and dealing with noise rather than filtering the noise and dealing with the signal. I realised slowly that most minds are trained to deal with what is visible and obvious rather than read the signal between the proverbial lines.
The legendary science fiction writer Isaac Asimov was once asked if science has created more unhappiness than happiness for the human race. His response was interesting. Paraphrased it says, science has caused both happiness and unhappiness. Having said that, there is no alternative but to continue to use science even more than before. There will never be any going back to the so-called ‘good old pastoral days’. Similarly, there is no going back from analytics. However, one does need to remember that analytics is a tool to be used intelligently – one shouldn’t become a slave to it.


