What management tool best reflects your customers’ satisfaction level?
What keeps most entrepreneurs up at night? It is one seemingly very simple question - are my customers happy? The most important resource for any business is the customer. He or she has the power to determine an organisation’s success or failure.

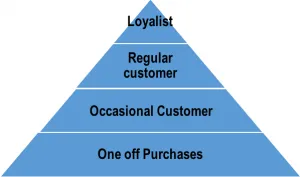
Customer satisfaction is a core performance indicator for business-to-consumer companies, and is one of the core metrics to be tracked by newly started business, for whom customer acquisition and retention is the key challenge. Acquiring new customers and ensuring repeat business is what any business strives for. Market surveys determine that it costs five times more for a business to retain a customer than to acquire one. Starting from one-off purchases, a customer graduates to being an occasional user to a regular customer, before becoming a loyalist.

Measuring and quantifying customer satisfaction effectively is very difficult, but various management tools can be employed. Here, we highlight some of the most used tools:
Net Promoter Score (NPS)
The Net Promoter Score is a customer-loyalty metric developed in 2003 by management consultant Fred Reichheld of Bain & Company in collaboration with Satmetrix. This management tool is used to gauge the customer’s overall satisfaction with the company’s product or service and his loyalty to the brand. It helps to measure the firm’s performance through its customers’ eyes.
NPS is based on responses to the question: How likely are you to recommend our company/product/service to a friend or colleague? The scoring for this answer is most often done on a scale of 0 to 10. Based on responses, the customers can be divided into three categories.
"Promoters" (rated 9 or 10) – These are the ones at the top of the customer acquisition chart. They are loyal enthusiasts who keep coming back to the company. They are whole-hearted evangelists who recommend the product or service to other potential buyers.
"Passives" (rated 7 or 8) – At the lower end of the customer acquisition chart, these are the satisfied customers, who lack loyalty. They like the company but won’t mind trying another product or service with a special discount or offer. These can be easily wooed by the competition.
"Detractors" (rated 0 to 6) – They are unhappy customers. They are not thrilled with the product/service and are unlikely to ever go back to the company and will possibly bad mouth the company. This category can easily target the “Passives”.
NPS is a simple calculation wherein the percentage of customers who are detractors is subtracted from the percentage who are promoters. What is generated is a score between -100 and 100 called the Net Promoter Score.

NPS is a simple but powerful tool. The higher the NPS of a firm compared to the competition, the more its chances to outperform in the market. NPS is a good measurement framework that is tightly tied to the customer and is a metric to be closely monitored by an organisation aiming to grow fast or improve profitability.
Customer satisfaction score (CSAT)
The Customer Satisfaction Score (CSAT) is a management tool used to measure a customer’s satisfaction for the service received. CSAT is often determined by the question “How would you rate your overall satisfaction with the service/product you received?”. The responses may be collected through a set of queries, or a long survey to assess their experience. This method is a great tool to close the loop on a customer interaction and offer the customers an opportunity to give a quick thumbs up or thumbs down for their latest experience with the brand. The answers are quantified, then expressed as a percentage between 0 and 100.
A high percentage indicates that your customers are highly satisfied.

Customer Effort Score (CES)
This method has a different approach compared to the two mentioned above. Developed in 2008 by an US research and advisory firm Corporate Executive Board (CEB), the tool tries to access how much effort the customer had to put into a particular interaction with the company. CES is measured by asking a single question: “How much effort did you personally have to put forth to handle your request?” It is scored on a scale from 1 (very low effort) to 5 (very high effort).

However, this version had two restrictions. The scale is inverted (1 is good and 5 is bad), which survey takers would sometimes overlook and mark 5 for good. Secondly, the term “effort” is not easy to translate in all situations.
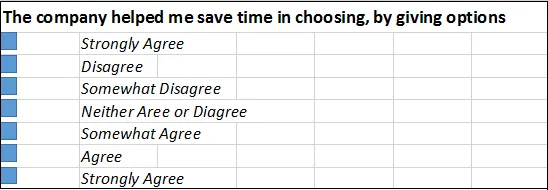
Thus, a second version was introduced where “effort” is replaced by a descriptive statement to avoid confusing the respondent. Also, the scale has an agreement and disagreement rating system. For example:

The responses are aggregated and an average is taken to gauge the level of effort made by the customer to interact with the company. A low average indicates that the company needs to work towards customer satisfaction.
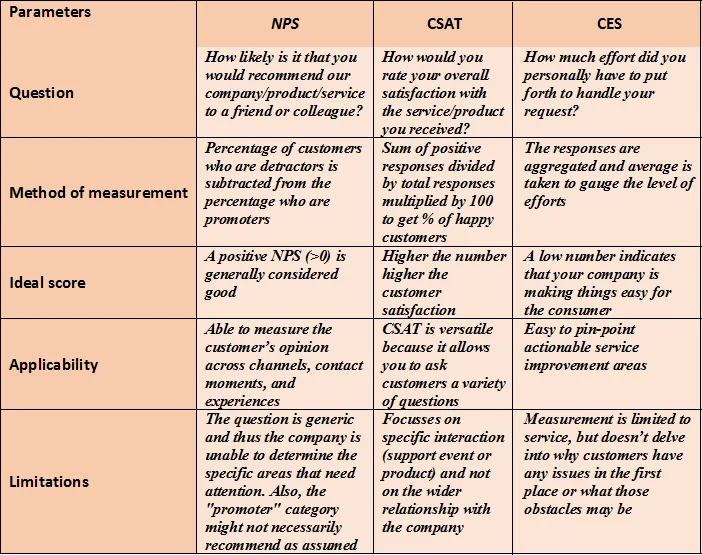
Comparative analysis

Conclusion
After looking closely at the various measurements of customer satisfaction, we see that every tool has its own limitations and applicability and relevance to the specific situation. To an extent, these tools are complementary and can be used simultaneously to access the actual happiness index of the customer. For example, after an event, the CSAT can be used to take feedback about satisfaction with content, timing, speaker’s quality, and location. The CES measures the effort the attendees had to make to sign up for this event, and in the end of the survey, NPS can be used to access how likely the they are to recommend the company based on this experience. No tool can individually address all the company’s elements. It is wisest to find a mix of all these tools and assess which is best suited to your company.


