The curious case of dissonance in MRPs for same products in e-commerce
We all know that online shopping offers a lot of benefits to shoppers. Apart from the convenience it offers, access to a wide assortment base, and of course discounts, are some added benefits. Often, we see retailers claiming large discounts being offered on products.

Oftentimes, the percentage discount that is mentioned drives price perception. Customers, when comparing prices across stores, view larger percentage discounts as a better deal. However, this is not always the case. To prove this point, let us first look at how discounts are calculated:
Percentage discounts are a function of the MRP/MSRP and the Selling Price. The MRP/MSRP is set by the manufacturer and the selling price is more often than not determined by the retailer.
The selling price of products being different across retailers is well known. Each retailer/merchant on marketplaces follows a certain pricing strategy to optimise for margins/sales. But, when the MRP/MSRP of the same products tend to vary across retailers, it gets confusing for a customer, and leads to a brand equity dilution for the brand manufacturer.
To analyse how deep this dissonance is, we decided to do a deeper dive. At DataWeave, we analyse data from millions of products on a regular basis. This ‘product data’ is further used to analyse prices and discounts across retailers. Doing this exercise on an ongoing basis gives us the ability to discern pricing strategies of retailers and access MRP/MSRP-related data. We created a sample list of products to monitor and analyse MRPs across brands and retailers, thereby to (dis)prove our hypothesis.
Here is what we found:
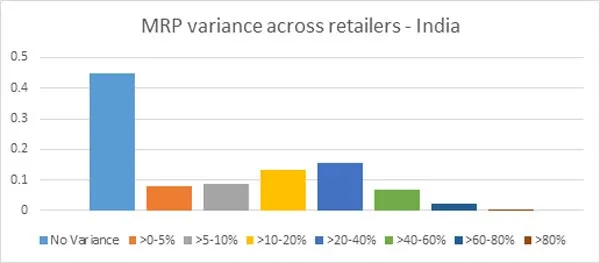
1) We analysed MRPs of around 400 brands across 10 categories. Around 44 percent of products in these brands have no variance in MRPs across retailers.
2) This also means that there is a certain degree of variance in 56 percent of products. The graph shown below offers a breakup of these variances.

3) Products in the “Mobile Phones and Tablets” category have the most price variance; 65 percent of the products have price variance.
4) Fashion & Fashion accessories have the least price variance; around 20 percent.
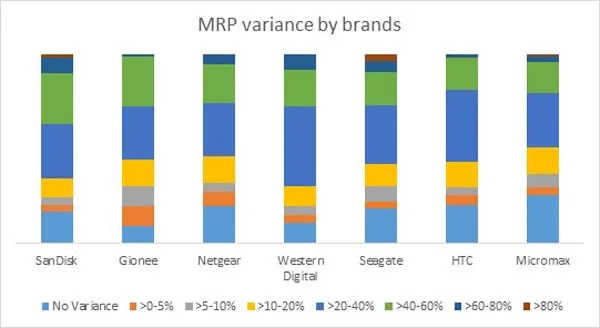
5) The graph below captures the brands having the most variance:

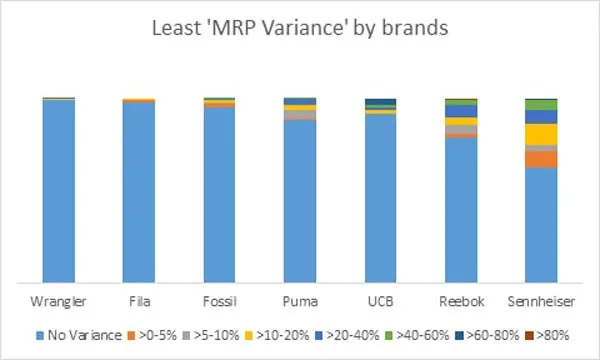
6) The graph below captures the brands having the least variance:

What are the implications of the above insights?
- Brands/manufacturers need to be aware of how their brand products are being represented and sold online. This is critical in protecting their brand equity.
- Consumers shopping online need to look at actual prices (instead of discount percentages) before making a buy decision on a particular store.
What can brands do to reduce this price dissonance?
- Analysing prices of their own products across marketplaces on a regular basis. This will help them to initiate conversations with marketplaces and merchants who sell through marketplaces.
- Create and maintain a digital catalogue that can be referred to and used by all merchants so that there is consistency in what is being communicated to consumers.
(Disclaimer: The views and opinions expressed in this article are those of the author and do not necessarily reflect the views of YourStory.)


